

This computer science problem involves algorithmic thinking and programming concepts. The solution below explains the approach, logic, and implementation step by step.
ScanSolve AI Answer
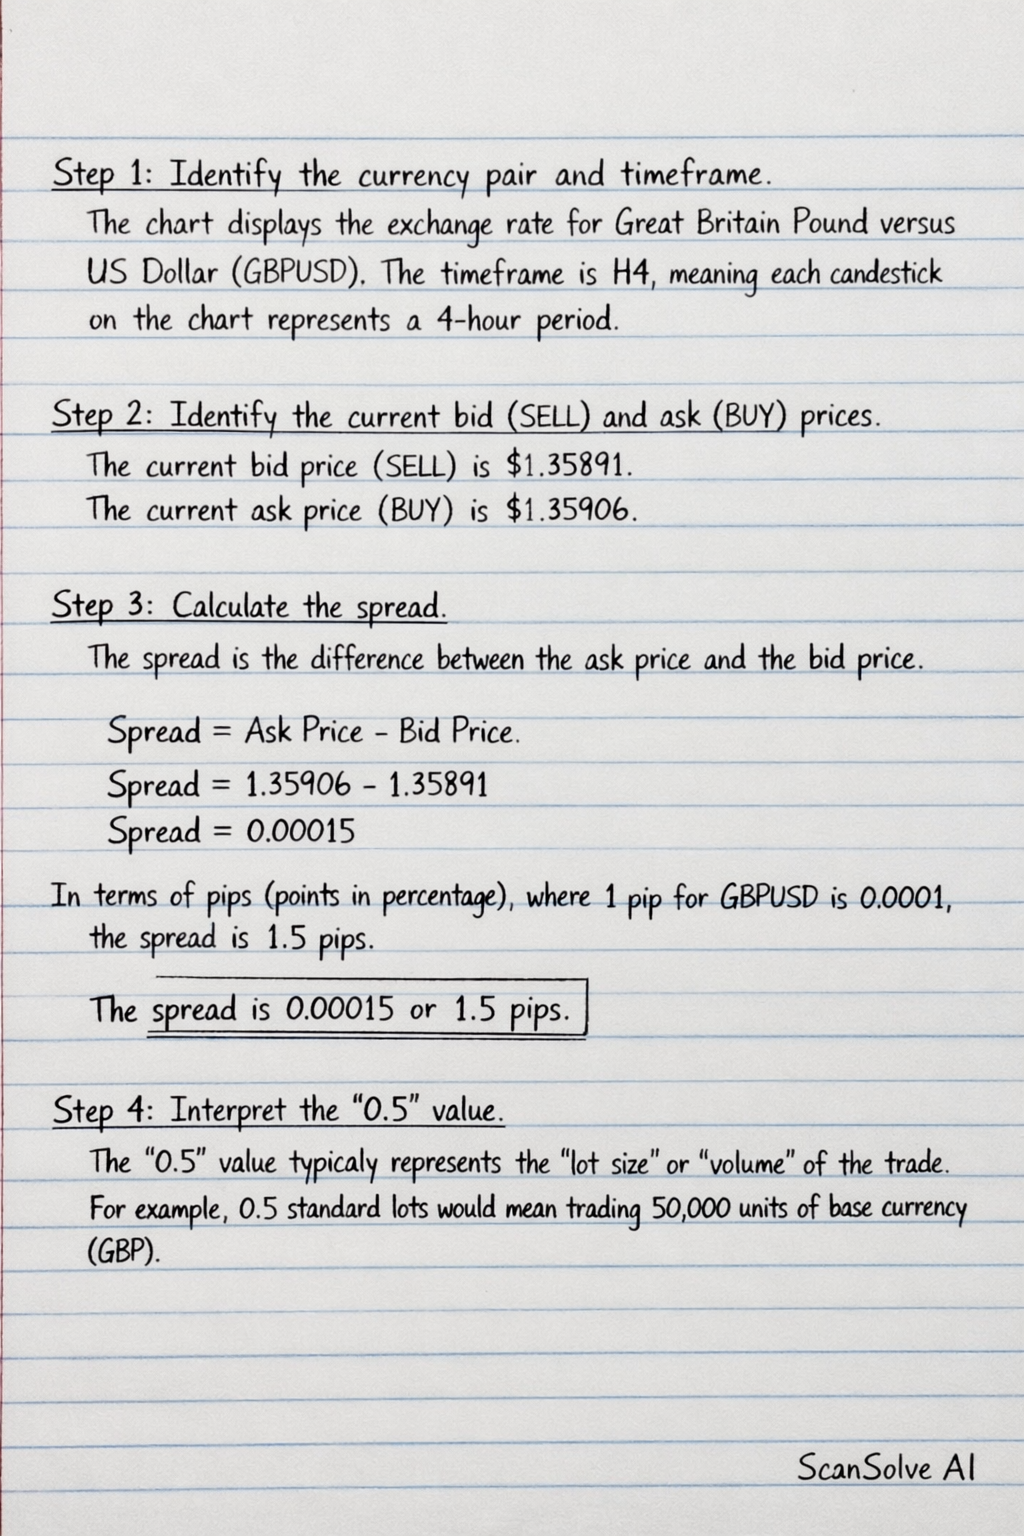
Step 1: Identify the currency pair and timeframe. The chart displays the exchange rate for the Great Britain Pound versus US Dollar (GBPUSD). The timeframe is H4, meaning each candlestick on the chart represents a 4-hour period. Step 2: Identify the current bid (SELL) and ask (BUY) prices. The current bid price (SELL) is 1.35891. The current ask price (BUY) is 1.35906. Step 3: Calculate the spread. The spread is the difference between the ask price and the bid price. Spread = Ask Price - Bid Price Spread = 1.35906 - 1.35891 Spread = 0.00015 In terms of pips (points in percentage), where 1 pip for GBPUSD is 0.0001, the spread is 1.5 pips. The spread is 0.00015 or 1.5 pips. Step 4: Interpret the "0.5" value. The "0.5" value typically represents the lot size or volume of the trade. For example, 0.5 standard lots would mean trading 50,000 units of the base currency (GBP). Step 5: Explain the red arrow. The red arrow on the chart points to a previous upward price movement, indicating a period of bullish trend or price appreciation for GBP against the USD. Send me the next one 📸