
We read your photo as:
A) To derive the market demand and supply schedules, we sum the individual quantities at each price level.
ScanSolve AI Answer
Answer
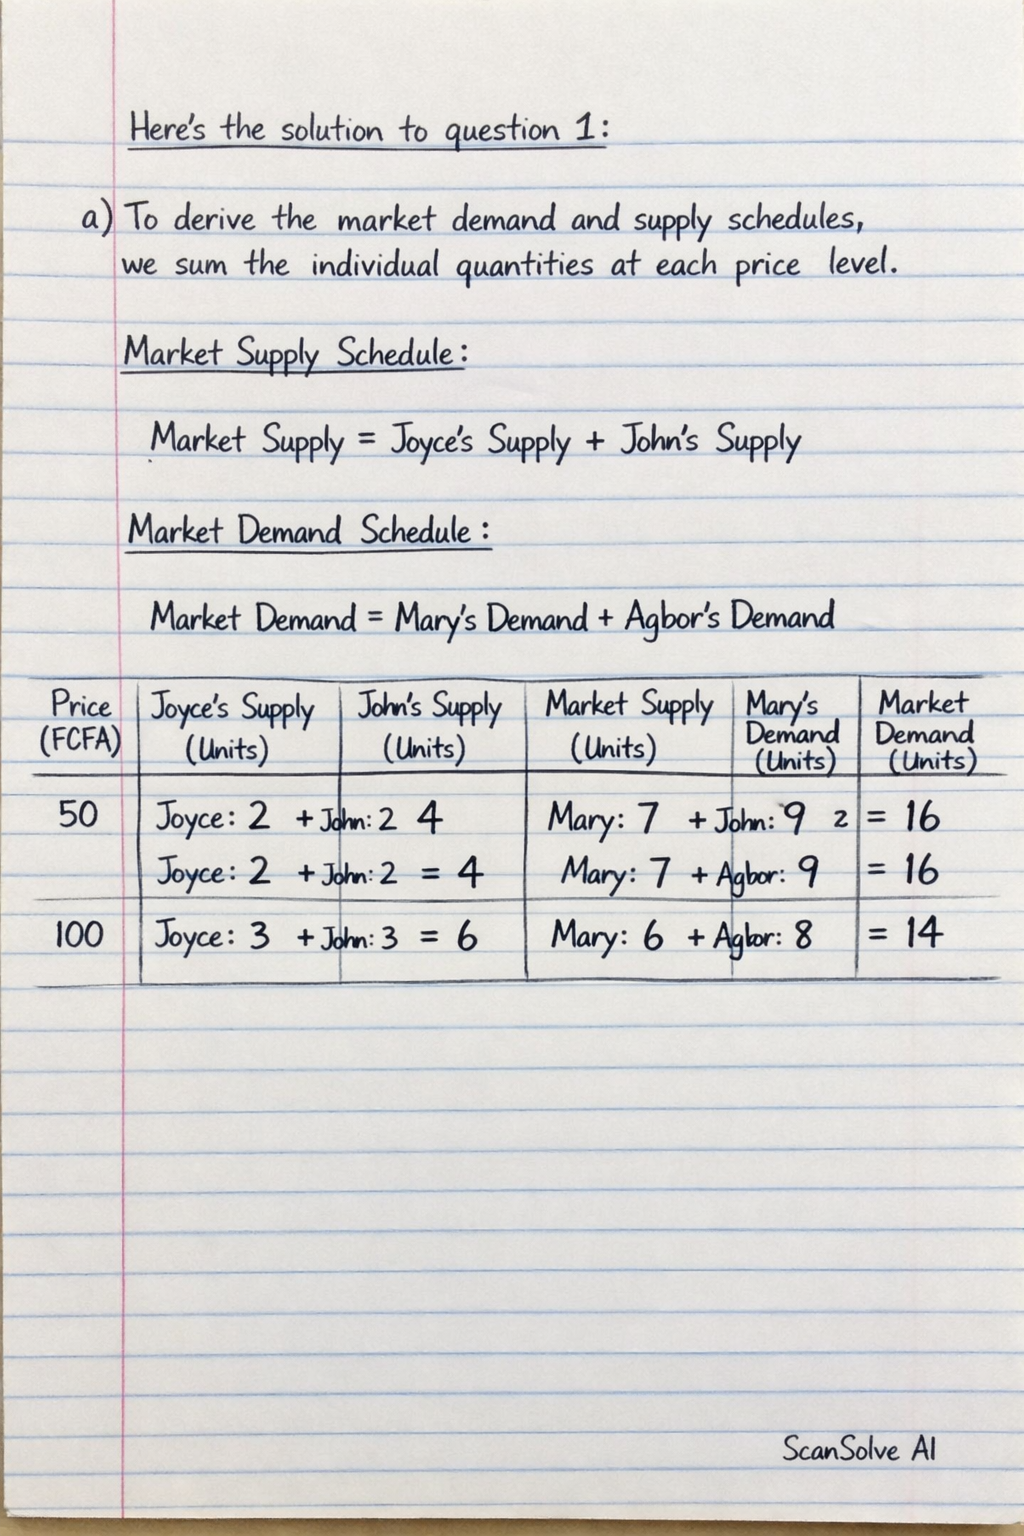
Here's the solution to question 1:
a) To derive the market demand and supply schedules, we sum the individual quantities at each price level.
Market Supply Schedule:
- Market Supply = Joyce's Supply + John's Supply
Market Demand Schedule:
- Market Demand = Mary's Demand + Agbor's Demand
| Price (FCFA) | Joyce's Supply (Units) | John's Supply (Units) | Market Supply (Units) | Mary's Demand (Units) | Agbor's Demand (Units) | Market Demand (Units) |
|---|---|---|---|---|---|---|
| 50 | 2 | 2 | 4 | 7 | 9 | 16 |
| 100 | 3 | 3 | 6 | 6 | 8 | 14 |
| 150 | 4 | 5 | 9 | 5 | 7 | 12 |
| 200 | 5 | 7 | 12 | 4 | 5 | 9 |
| 250 | 6 | 8 | 14 | 3 | 3 | 6 |
| 300 | 7 | 9 | 16 | 2 | 2 | 4 |
b)
(i) To derive the market demand and supply curves on a single graph:
- Draw a graph with Price (FCFA) on the vertical (Y) axis and Quantity (Units) on the horizontal (X) axis.
- Plot the points for the Market Supply schedule (Price, Market Supply) from the table above. Connect these points to form the upward-sloping Market Supply curve.
- Plot the points for the Market Demand schedule (Price, Market Demand) from the table above. Connect these points to form the downward-sloping Market Demand curve.
(ii) To estimate the equilibrium price and quantity from the graph, we find the point where the Market Demand curve intersects the Market Supply curve. Looking at the derived schedules:
- At Price = 150 FCFA, Market Supply = 9 units and Market Demand = 12 units.
- At Price = 200 FCFA, Market Supply = 12 units and Market Demand = 9 units.
The equilibrium occurs between these two price points where quantity demanded equals quantity supplied.
Using linear interpolation:
Equilibrium Price:
Equilibrium Quantity:
c) The three laws of demand and supply shown by the graph are:
- Law of Demand: There is an inverse relationship between the price of a good and the quantity demanded, assuming all other factors remain constant. As price increases, quantity demanded decreases.
- Law of Supply: There is a direct relationship between the price of a good and the quantity supplied, assuming all other factors remain constant. As price increases, quantity supplied increases.
- Law of Equilibrium: In a free market, the price of a good will adjust until the quantity demanded equals the quantity supplied, establishing an equilibrium price and quantity where the market clears.
d) Outline two reasons for the shape of:
(i) The demand curve (downward sloping):
- Diminishing Marginal Utility: As a consumer consumes more units of a good, the additional satisfaction (marginal utility) derived from each successive unit decreases. Therefore, consumers are only willing to buy more units if the price is lower.
- Income and Substitution Effects: When the price of a good falls, consumers' real income effectively increases (income effect), allowing them to buy more. Also, the good becomes relatively cheaper compared to substitutes (substitution effect), leading consumers to buy more of it.
(ii) The supply curve (upward sloping):
- Profit Motive: Producers are motivated by profit. As the market price of a good increases, producing and selling that good becomes more profitable, encouraging existing producers to increase output and potentially attracting new producers to the market.
- Increasing Marginal Costs: To produce additional units of a good, producers often incur higher marginal costs (e.g., needing to pay overtime, using less efficient resources). To cover these higher costs and maintain profitability, producers require a higher price for each additional unit supplied.
Try one yourself
A new problem that tests the same skill.
Still stuck on this one?
Ask a follow-up, and the answer starts from this question.
More Economics Questions
Handwritten Step-by-Step Solution
Get this as a handwritten image on WhatsApp — like a tutor wrote it for you.
Try on WhatsApp