
We read your photo as:
What is an indifference curve and what does it show about consumer satisfaction?
ScanSolve AI Answer
Step-by-step solution
4 stepsThe image you've sent further illustrates the concept of indifference curves and the underlying theory.
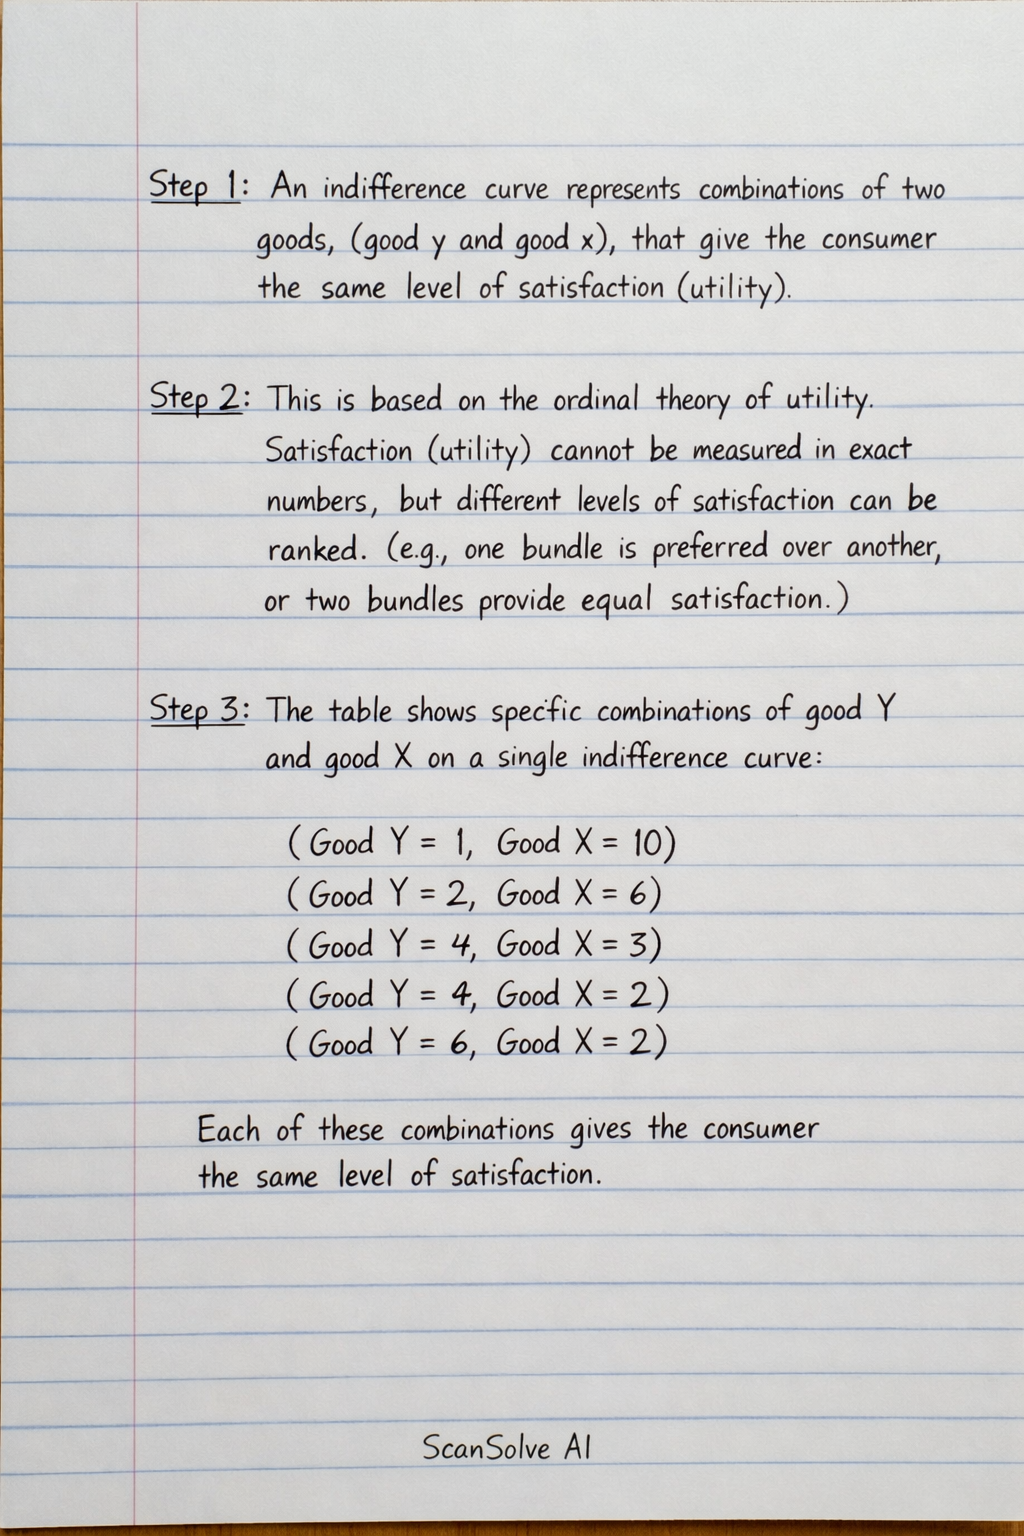
As stated in your notes, an indifference curve represents various combinations of two goods (labeled "good y" and "good x" in your table) that provide a consumer with the same level of satisfaction or utility.
The notes also explain that this approach is based on the ordinal theory of utility.
This theory assumes that satisfaction (utility) cannot be precisely measured in numerical units, but rather, different levels of satisfaction can only be ranked (e.g., one bundle is preferred over another, or two bundles provide equal satisfaction).
The table provided lists specific combinations of good Y and good X that lie on a single indifference curve
- (Good Y = 1, Good X = 10)
- (Good Y = 2, Good X = 6)
- (Good Y = 4, Good X = 3)
- (Good Y = 6, Good X = 2)
- (Good Y = 9, Good X = 1) Each of these combinations offers the consumer the same level of satisfaction.
The graph visually plots these points, connecting them to form a downward-sloping, convex curve labeled "IC".
This curve demonstrates that as the quantity of one good (e.g., good X) decreases, the quantity of the other good (good Y) must increase to maintain the same level of satisfaction.
Still stuck on this one?
Ask a follow-up, and the answer starts from this question.
More Economics Questions
Handwritten Step-by-Step Solution
Get this as a handwritten image on WhatsApp — like a tutor wrote it for you.
Try on WhatsApp