
We read your photo as:
Analyze the relationship between Price (P) and Quantity (Q) using the given data points and calculate the slope.
Economics
ScanSolve AI Answer
This answer stops before the end.
It was cut off when it was first written. Ask ScanSolve this question again for the full working.
Step 1: Analyze the change in with respect to the change in to determine the type of relationship.
Let's calculate the slope for consecutive pairs of points:
- For and :
- For and :
Was this helpful?
Still stuck on this one?
Ask a follow-up, and the answer starts from this question.
Got a different question?Ask your own question
More Economics Questions
QCalculate the price elasticity of demand at Point A and Point B, given P1=45, Q1=20 and P2=35…QFind the equation of the straight line through P and Q, the coordinates of P and Q, and calculate…QFind the gradient of the line passing through the points P(1, −1/2) and Q(3, −8 1/2).QGiven the demand for a product as Qd = 100 − 5P and the supply is given as Qs = −20 + 3P. You are…QGiven the demand function Qd = 20 − 2p and supply function Qs = 10 + 3p, determine the equilibrium…
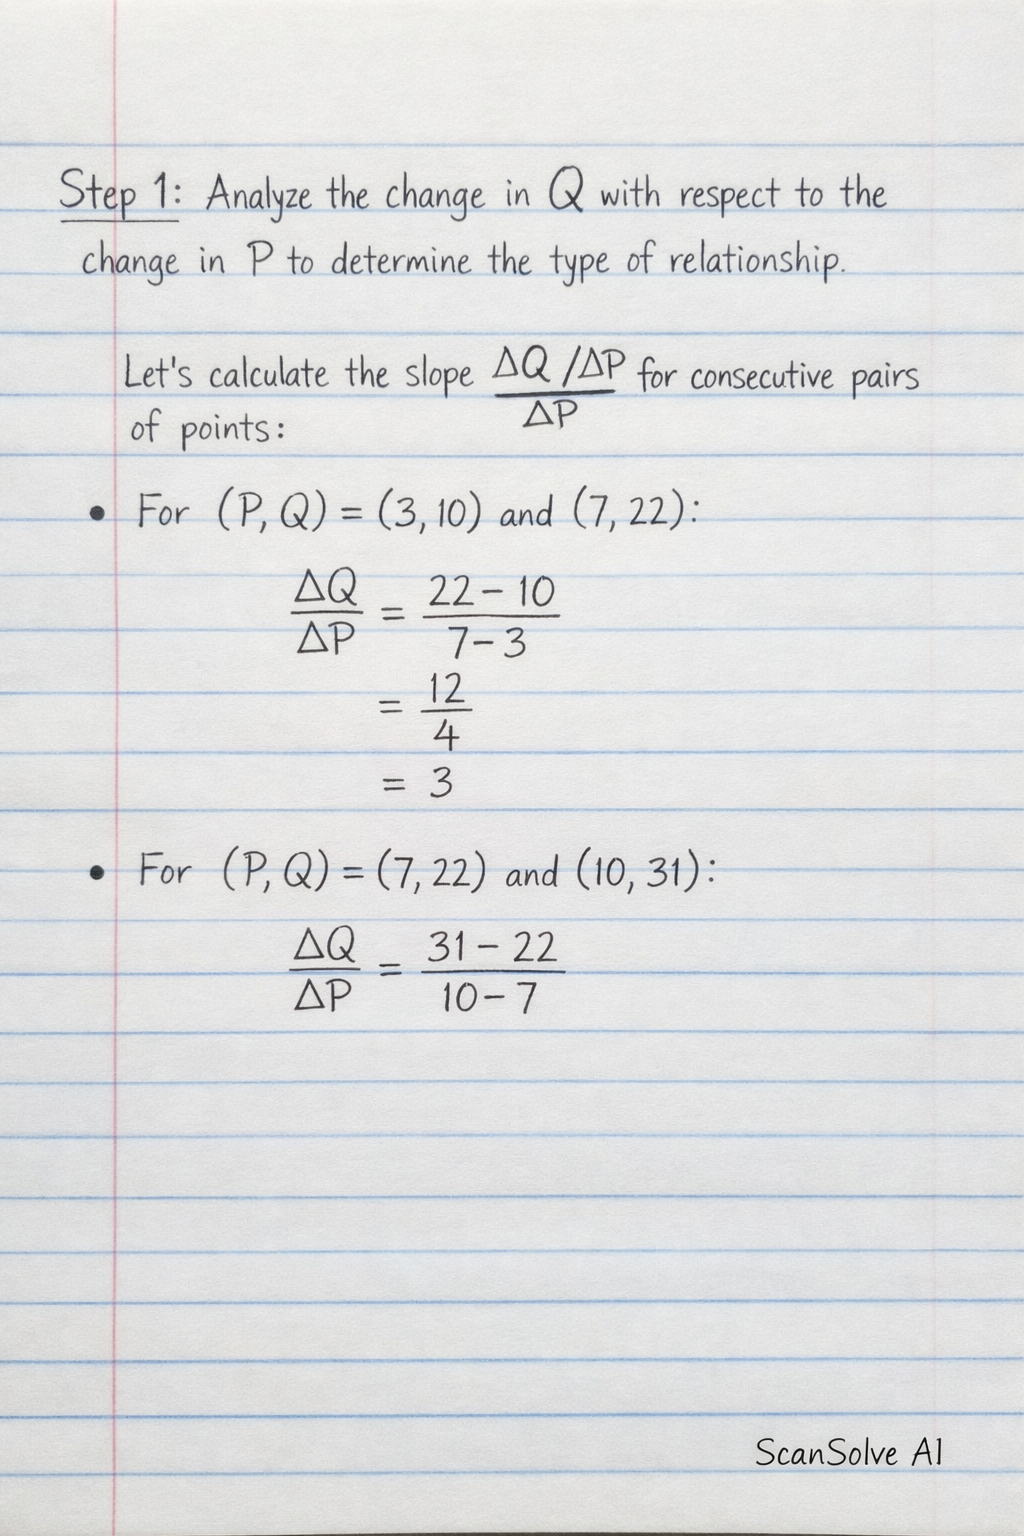
Handwritten Step-by-Step Solution
Get this as a handwritten image on WhatsApp — like a tutor wrote it for you.
Try on WhatsApp