
We read your photo as:
Create a bar graph illustrating the main budget allocations from the 2023 National Budget.
Economics
ScanSolve AI Answer
Step-by-step solution
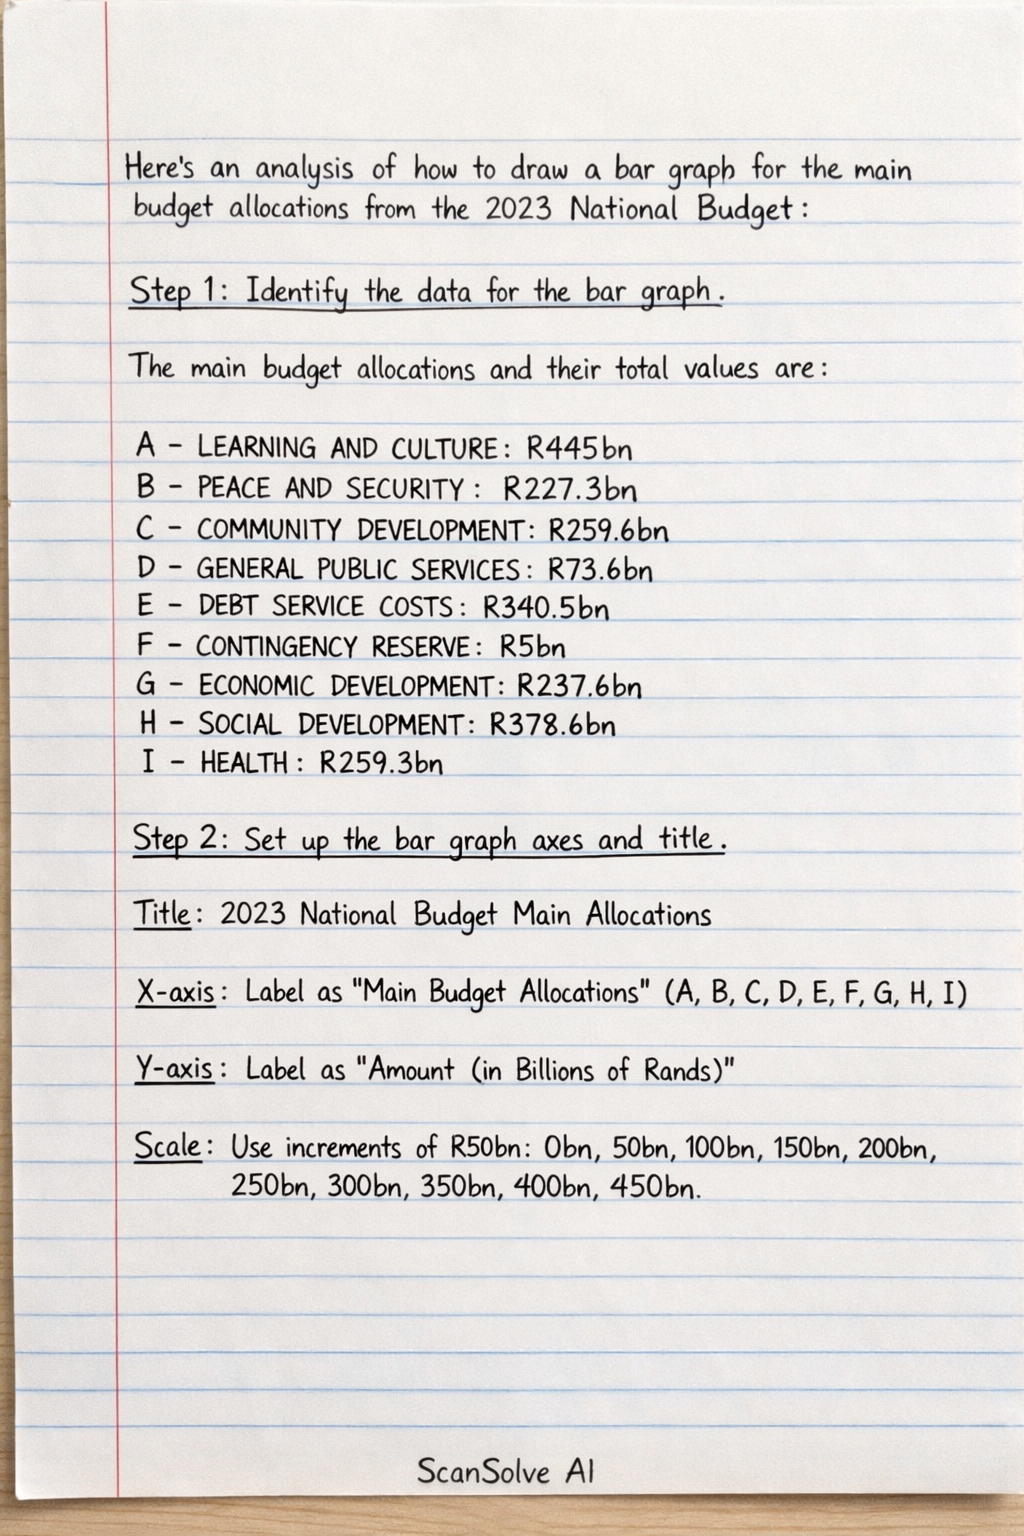
3 stepsTo draw a bar graph for the main budget allocations from the 2023 National Budget:
Identify the data for the bar graph.
The main budget allocations and their total values are:
- A - LEARNING AND CULTURE: R445bn
- B - PEACE AND SECURITY: R227.3bn
- C - COMMUNITY DEVELOPMENT: R259.6bn
- D - GENERAL PUBLIC SERVICES: R73.6bn
- E - DEBT SERVICE COSTS: R340.5bn
- F - CONTINGENCY RESERVE: R5bn
- G - ECONOMIC DEVELOPMENT: R237.6bn
- H - SOCIAL DEVELOPMENT: R378.6bn
- I - HEALTH: R259.3bn
Set up the bar graph axes and title.
- Title: 2023 National Budget Main Allocations
- X-axis (Horizontal): Label this axis "Main Budget Allocations". Each category (A, B, C, D, E, F, G, H, I) will be represented by a separate bar.
- Y-axis (Vertical): Label this axis "Amount (in Billions of Rands)". Choose a suitable scale, such as increments of R50bn or R100bn, ranging from R0bn up to at least R450bn to accommodate the highest value (R445bn).
Plot the bars.
For each allocation, draw a bar whose height corresponds to its value on the y-axis. Ensure all bars have equal width and consistent spacing between them.
Was this helpful?
Still stuck on this one?
Ask a follow-up, and the answer starts from this question.
Got a different question?Ask your own question
More Economics Questions
QIdentify all main budget allocations and their total values from the provided data.QCreate a bar graph showing the percentage of water used per sector in North West for 2024.QThe table below shows the budgetary allocation of a country to selected sectors of the economy in a…QIdentify the budget position for all three years from Table 3.QPart i: Plot a bar graph representing the information.
Handwritten Step-by-Step Solution
Get this as a handwritten image on WhatsApp — like a tutor wrote it for you.
Try on WhatsApp