
We read your photo as:
Part i: Plot a bar graph representing the information.
English
ScanSolve AI Answer
Answers
3 partsStep-by-step solution
8 stepsPart i
Plot a bar graph representing the information.
To plot a bar graph:
- Draw a horizontal axis (x-axis) and label it "Year". Mark the years 2019, 2020, 2021, 2022, and 2023 at equal intervals.
- Draw a vertical axis (y-axis) and label it "Number of Cars Sold". Choose an appropriate scale, for example, from 0 to 100 with intervals of 10.
- For each year, draw a bar whose height corresponds to the number of cars sold for that year:
- 2019: Bar height up to 50
- 2020: Bar height up to 65
- 2021: Bar height up to 80
- 2022: Bar height up to 75
- 2023: Bar height up to 90
- Ensure the bars are of equal width and have consistent spacing between them.
Part ii
Identify the year with the highest sales.
Examine the "Cars sold" column in the table.
The sales figures are 50, 65, 80, 75, and 90.
Identify the maximum value.
The highest number of cars sold is 90.
Determine the corresponding year.
The year with 90 cars sold is 2023.
The year with the highest sales is .
Part iii
Calculate the average number of cars sold per year.
Sum the total number of cars sold over the five years.
Divide the total by the number of years (5).
The average number of cars sold per year is .
Part iv
Determine the percentage increase in sales from 2019 to 2023.
Identify the sales in 2019 and 2023.
Calculate the increase in sales.
Calculate the percentage increase using the formula
.
The percentage increase in sales from 2019 to 2023 is .
Was this helpful?
Try one yourself
A new problem that tests the same skill.
Still stuck on this one?
Ask a follow-up, and the answer starts from this question.
Got a different question?Ask your own question
More English Questions
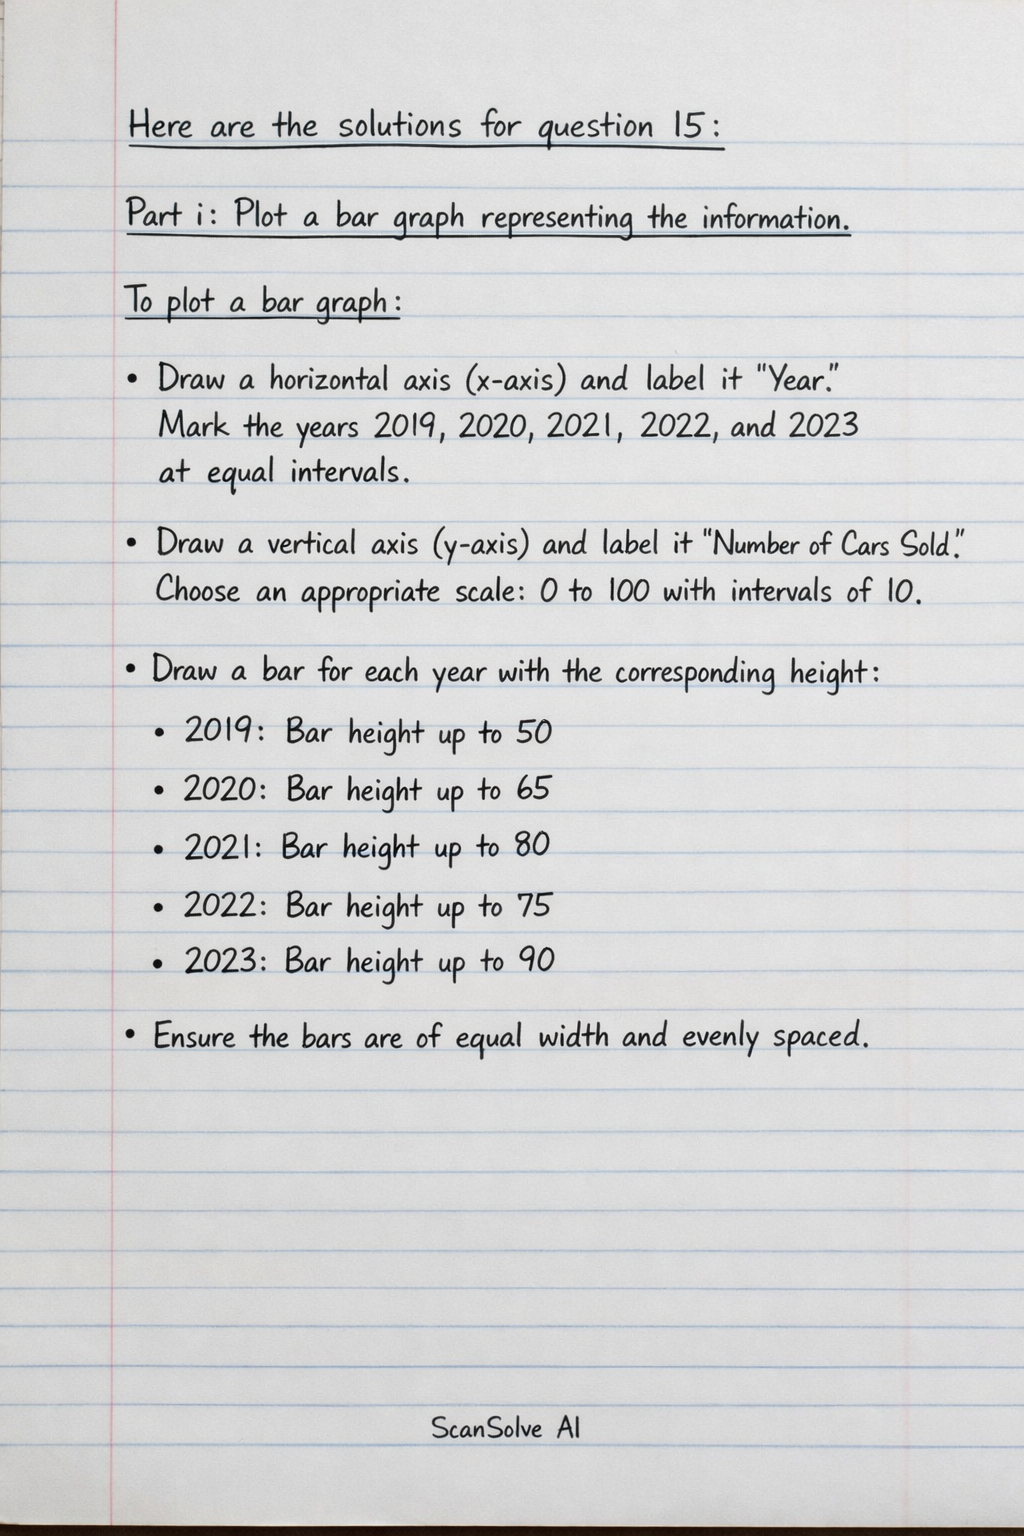
Handwritten Step-by-Step Solution
Get this as a handwritten image on WhatsApp — like a tutor wrote it for you.
Try on WhatsApp