
We read your photo as:
Distinguish clearly between demand, individual demand schedule and individual demand curve, and market demand schedule and market demand curve using appropriate tables and diagrams.
ScanSolve AI Answer
Step-by-step solution
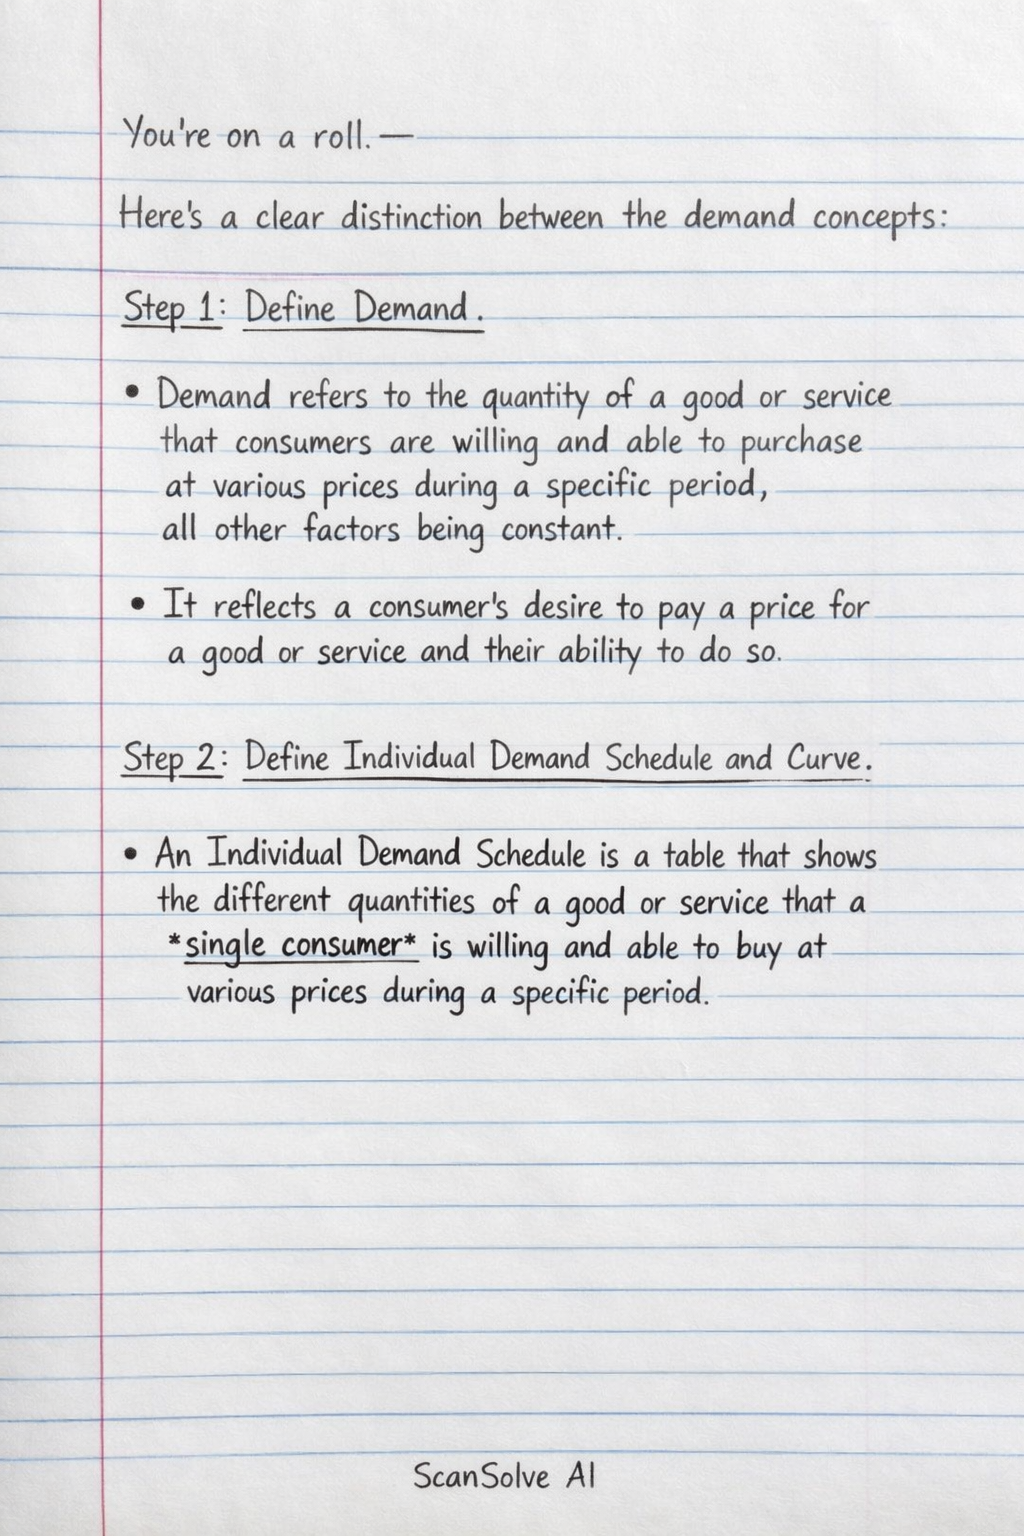
3 stepsHere's a clear distinction between the demand concepts:
Define Demand.
- Demand refers to the quantity of a good or service that consumers are willing and able to purchase at various prices during a specific period, all other factors being constant. It reflects a consumer's desire to pay a price for a good or service and their ability to do so.
Define Individual Demand Schedule and Curve.
-
An Individual Demand Schedule is a table that shows the different quantities of a good or service that a single consumer is willing and able to buy at various prices during a specific period.
Example: Individual Demand Schedule for Product X
-
An Individual Demand Curve is a graphical representation of the individual demand schedule. It plots the price on the y-axis and the quantity demanded on the x-axis. The curve typically slopes downwards from left to right, illustrating the inverse relationship between price and quantity demanded (the Law of Demand).
Diagram Description: Imagine a graph with Price on the vertical axis and Quantity Demanded on the horizontal axis. Plotting the points from the example table (e.g., (2,10), (4,8), etc.) and connecting them would form a downward-sloping line or curve.
-
Define Market Demand Schedule and Curve.
-
A Market Demand Schedule is a table that shows the total quantities of a good or service that all consumers in a market are willing and able to buy at various prices during a specific period. It is derived by horizontally summing the individual demand schedules of all consumers in the market.
Example: Market Demand Schedule for Product X (assuming two consumers, A and B)
-
A Market Demand Curve is a graphical representation of the market demand schedule. It is obtained by horizontally summing the individual demand curves of all consumers in the market. Like the individual demand curve, it also slopes downwards from left to right, but it is typically flatter, reflecting a greater responsiveness of total quantity demanded to price changes.
Diagram Description: Imagine a graph with Price on the vertical axis and Quantity Demanded on the horizontal axis. If you have individual demand curves for Consumer A and Consumer B, the market demand curve is found by adding the quantities demanded by A and B at each price level. For example, at Price N10, if A demands 2 and B demands 3, the market demands 5. This curve will also be downward-sloping, but generally less steep than individual curves.
-
Still stuck on this one?
Ask a follow-up, and the answer starts from this question.
More Economics Questions
Handwritten Step-by-Step Solution
Get this as a handwritten image on WhatsApp — like a tutor wrote it for you.
Try on WhatsApp