
This economics question tests your understanding of economic models and analysis. The step-by-step answer below applies the relevant framework and explains the reasoning.
ScanSolve AI Answer
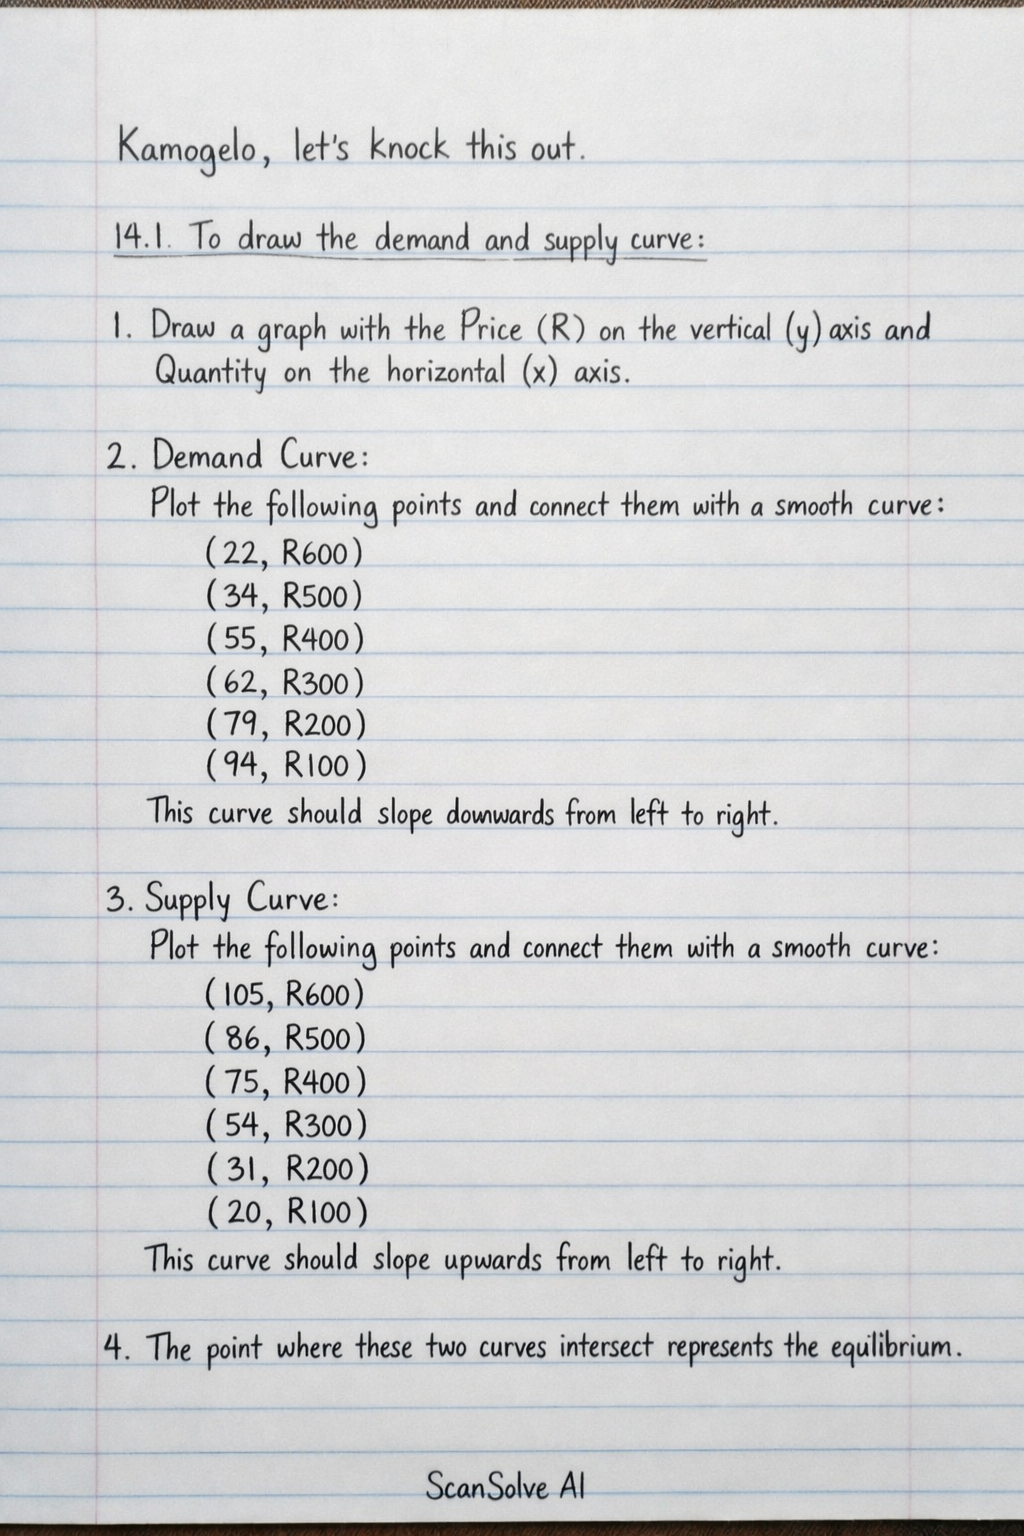
kamogelo, let's knock this out. 14.1 To draw the demand and supply curve: Draw a graph with the Price (R) on the vertical (y) axis and Quantity* on the horizontal (x) axis. Demand Curve: Plot the following points (Quantity Demanded, Price) and connect them with a smooth curve: (22, R600) (34, R500) (55, R400) (62, R300) (79, R200) (94, R100) This curve should slope downwards from left to right. Supply Curve: Plot the following points (Quantity Supplied, Price) and connect them with a smooth curve: (105, R600) (86, R500) (75, R400) (54, R300) (31, R200) (20, R100) This curve should slope upwards from left to right. The point where these two curves intersect represents the equilibrium. 14.2 Step 1: Identify the prices where quantity demanded and quantity supplied are closest. At R400, Quantity Demanded = 55 and Quantity Supplied = 75. At R300, Quantity Demanded = 62 and Quantity Supplied = 54. Step 2: The equilibrium price is where quantity demanded equals quantity supplied. Since it's not exactly in the table, we interpolate between R300 and R400. Using linear interpolation, the equilibrium price is approximately R328.57. The equilibrium price is R328.57. 14.3 Step 1: The equilibrium quantity corresponds to the equilibrium price where quantity demanded equals quantity supplied. Using linear interpolation, the equilibrium quantity is approximately 60 units. The equilibrium quantity is 60 units. 15.1 Demand is the quantity of a good or service that consumers are willing and able to purchase at various prices during a specific period. 15.2 The demand curve slopes downward from left to right due to the Law of Demand, which states that as the price of a good increases, the quantity demanded decreases, assuming all other factors remain constant. Consumers buy less at higher prices because their purchasing power decreases (income effect) and they may switch to cheaper alternatives (substitution effect). 15.3 The Law of Supply states that, ceteris paribus (all else being equal), as the price of a good or service increases, the quantity supplied by producers also increases. Conversely, as the price decreases, the quantity supplied decreases. This is because higher prices generally lead to higher profit opportunities for producers, incentivizing them to produce and sell more. 15.4 Supply is the quantity of a good or service that producers are willing and able to offer for sale at various prices during a specific period. Send me the next one 📸