
This economics question tests your understanding of economic models and analysis. The step-by-step answer below applies the relevant framework and explains the reasoning.
ScanSolve AI Answer
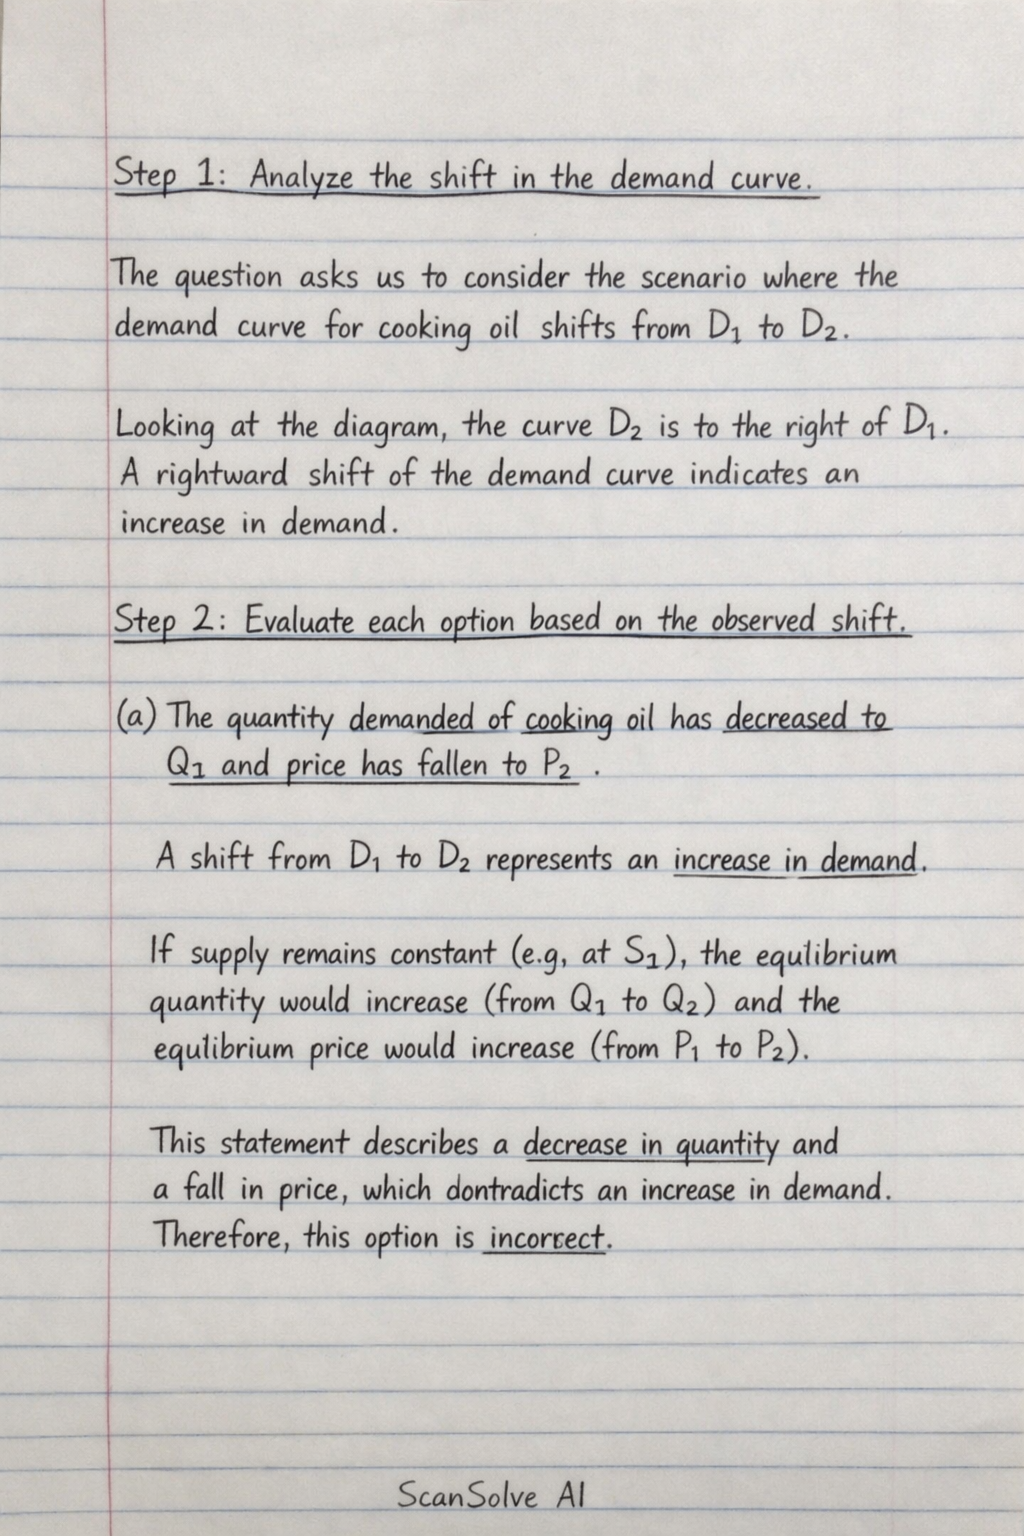
Step 1: Analyze the shift in the demand curve. The question asks us to consider the scenario where the demand curve for cooking oil shifts from D_1 to D_2. Looking at the diagram, the curve D_2 is to the right of D_1. A rightward shift of the demand curve indicates an increase in demand. Step 2: Evaluate each option based on the observed shift. a) The quantity demanded of cooking oil has decreased to Q1 and price has fallen to P2. A shift from D_1 to D_2 represents an increase in demand. If supply remains constant (e.g., at S_1), the equilibrium quantity would increase (from Q_1 to Q_2) and the equilibrium price would increase (from P_1 to P_2). This statement describes a decrease in quantity and a fall in price, which contradicts an increase in demand. Therefore, this option is incorrect. b) The price of coconut oil which is a substitute for cooking oil must have fallen. If the price of a substitute good (like coconut oil) falls, consumers would buy more of the substitute and less of cooking oil. This would lead to a decrease in demand for cooking oil, causing the demand curve to shift to the left*. The diagram shows a rightward shift (D_1 to D_2), which is an increase in demand. Therefore, this option is incorrect. c) There has been an increase in demand for cooking oil. As established in Step 1, a rightward shift of the demand curve from D_1 to D_2 signifies an increase in demand*. This statement accurately describes the shift shown in the diagram. d) The higher price of cooking oil has caused the quantity demanded to fall from OQ1 to OQ2. A change in the price of the good itself causes a movement along the demand curve, not a shift of the entire curve. A higher price would cause a decrease in the quantity demanded (moving up along a single demand curve). The question describes a shift of the demand curve. Furthermore, if demand shifts from D_1 to D_2 (with supply S_1), the quantity increases* from Q_1 to Q_2, not falls. Therefore, this option is incorrect. Step 3: Conclude the correct option. Based on the analysis, the shift from D_1 to D_2 represents an increase in demand for cooking oil. The final answer is c). Just one more to go today! What's next?