
We read your photo as:
Explain the law of supply and illustrate a change in quantity supplied with an example and diagram.
ScanSolve AI Answer
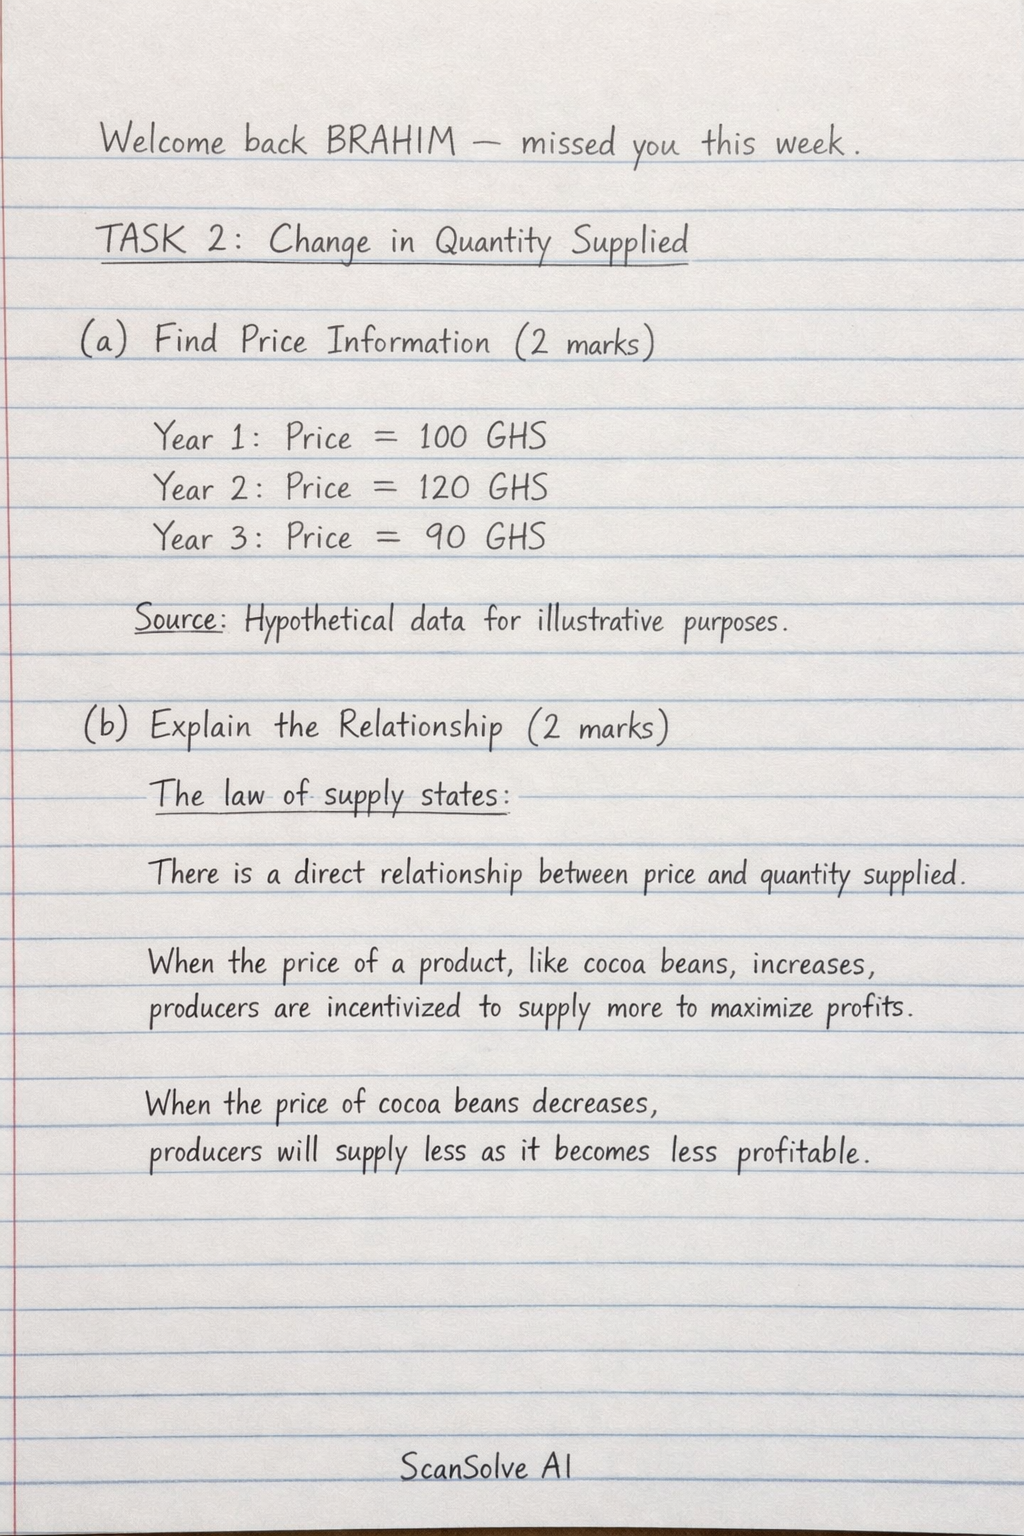
TASK 2: Change in Quantity Supplied
a) Find Price Information (2 marks)
Since no specific product is provided, here are example prices for a hypothetical product (e.g., cocoa beans) in Ghana Cedis (GHS):
- Year 1: Price = 100 GHS
- Year 2: Price = 120 GHS
- Year 3: Price = 90 GHS Source: Hypothetical data for illustrative purposes.
b) Explain the Relationship (2 marks)
The law of supply states that there is a direct relationship between price and quantity supplied. When the price of a product, such as cocoa beans, goes up, producers are incentivized to supply more to maximize profits. Conversely, when the price of cocoa beans goes down, producers will supply less as it becomes less profitable.
c) Draw a Simple Diagram (2 marks)
To illustrate a change in quantity supplied:
- Draw a graph with the vertical axis labeled "Price" and the horizontal axis labeled "Quantity".
- Draw an upward-sloping curve labeled "S" (Supply Curve).
- Mark a point A on the lower left part of the curve, representing a low price and a low quantity supplied.
- Mark a point B on the upper right part of the curve, representing a high price and a high quantity supplied.
- Draw an arrow along the supply curve from point A to point B, indicating an increase in quantity supplied due to a price increase.
- Label this movement along the curve as "Change in Quantity Supplied".
Still stuck on this one?
Ask a follow-up, and the answer starts from this question.
More Economics Questions
Handwritten Step-by-Step Solution
Get this as a handwritten image on WhatsApp — like a tutor wrote it for you.
Try on WhatsApp