

This economics question tests your understanding of economic models and analysis. The step-by-step answer below applies the relevant framework and explains the reasoning.
ScanSolve AI Answer
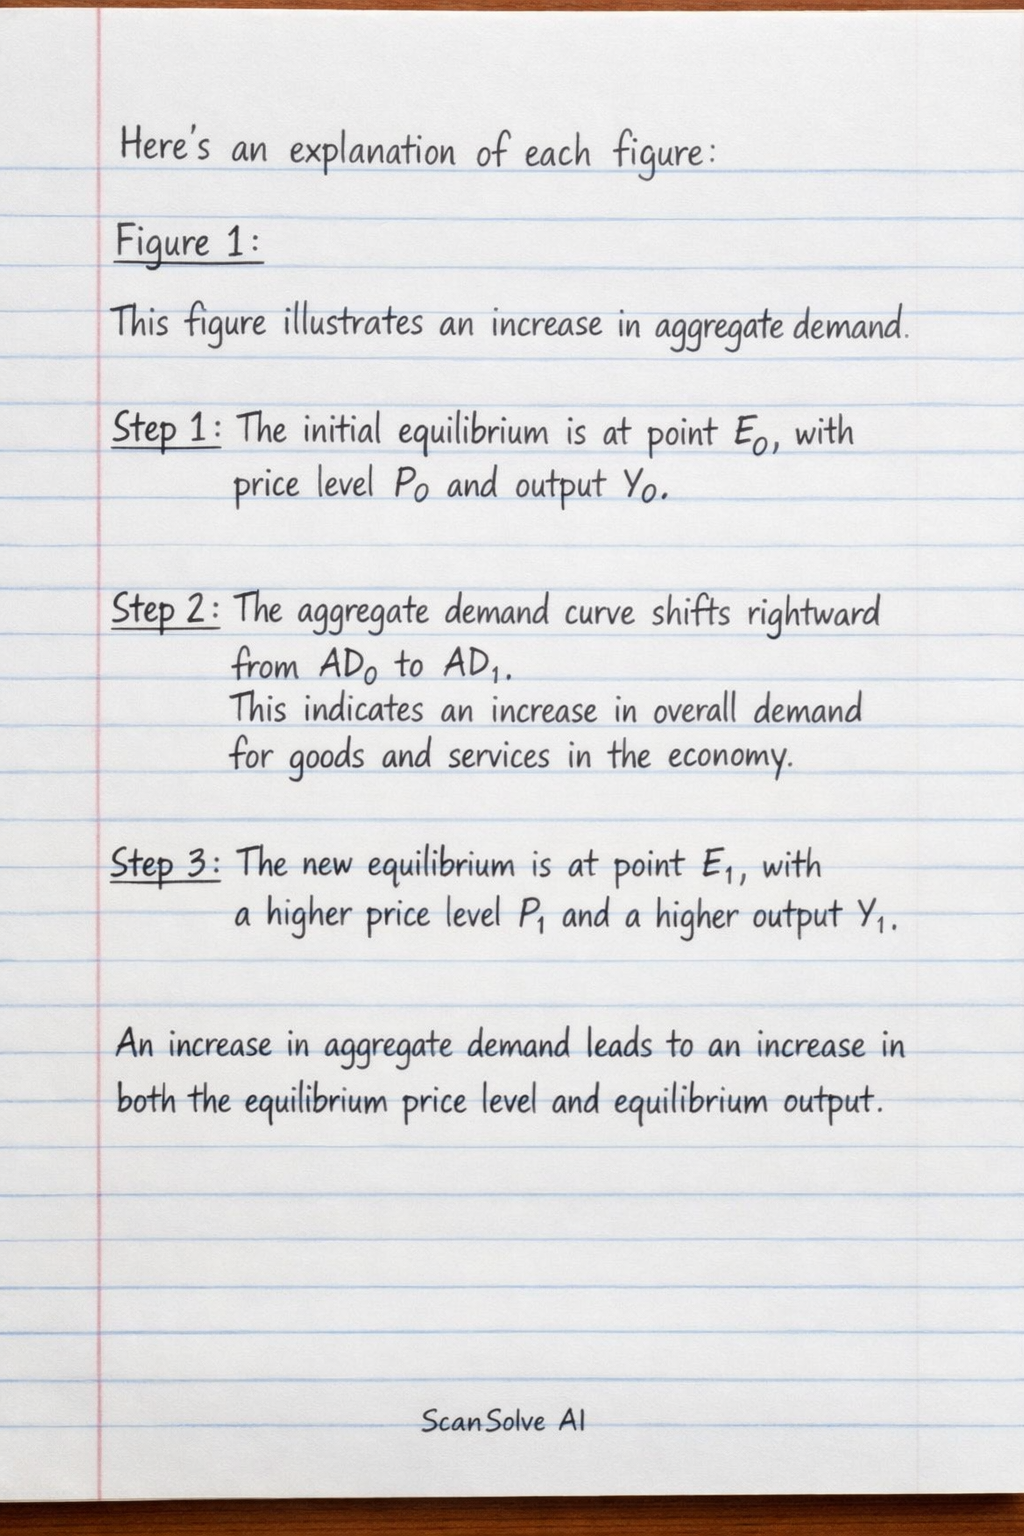
Here's an explanation of each figure: Figure 1: This figure illustrates an increase in aggregate demand. Step 1: The initial equilibrium is at point E_0, with price level P_0 and output Y_0. Step 2: The aggregate demand curve shifts rightward from AD_0 to AD_1. This indicates an increase in overall demand for goods and services in the economy. Step 3: The new equilibrium is at point E_1, with a higher price level P_1 and a higher output Y_1. An increase in aggregate demand leads to an increase in both the equilibrium price level and equilibrium output. Figure 2: This figure illustrates a decrease in aggregate demand. Step 1: The initial equilibrium is at point E_0, with price level P_0 and output E_0. Step 2: The aggregate demand curve shifts leftward from AD_0 to AD_1. This indicates a decrease in overall demand for goods and services in the economy. Step 3: The new equilibrium is at point E_1, with a lower price level P_1 and a lower output E_1. A decrease in aggregate demand leads to a decrease in both the equilibrium price level and equilibrium output. Figure 3: This figure illustrates an increase in aggregate supply. Step 1: The initial equilibrium is at point E_0, with price level P_0 and output E_0. Step 2: The aggregate supply curve shifts rightward from AS_0 to AS_1. This indicates an increase in the economy's ability to produce goods and services at any given price level. Step 3: The new equilibrium is at point E_1, with a lower price level P_1 and a higher output E_1. An increase in aggregate supply leads to a decrease in the equilibrium price level and an increase in equilibrium output. Figure 4: This figure illustrates a decrease in aggregate supply. Step 1: The initial equilibrium is at point E_0, with price level P_0 and output E_0. Step 2: The aggregate supply curve shifts leftward from AS_0 to AS_1. This indicates a decrease in the economy's ability to produce goods and services at any given price level. Step 3: The new equilibrium is at point E_1, with a higher price level P_1 and a lower output E_1. A decrease in aggregate supply leads to an increase in the equilibrium price level and a decrease in equilibrium output. That's 2 down. 3 left today — send the next one.