
This economics question tests your understanding of economic models and analysis. The step-by-step answer below applies the relevant framework and explains the reasoning.
ScanSolve AI Answer
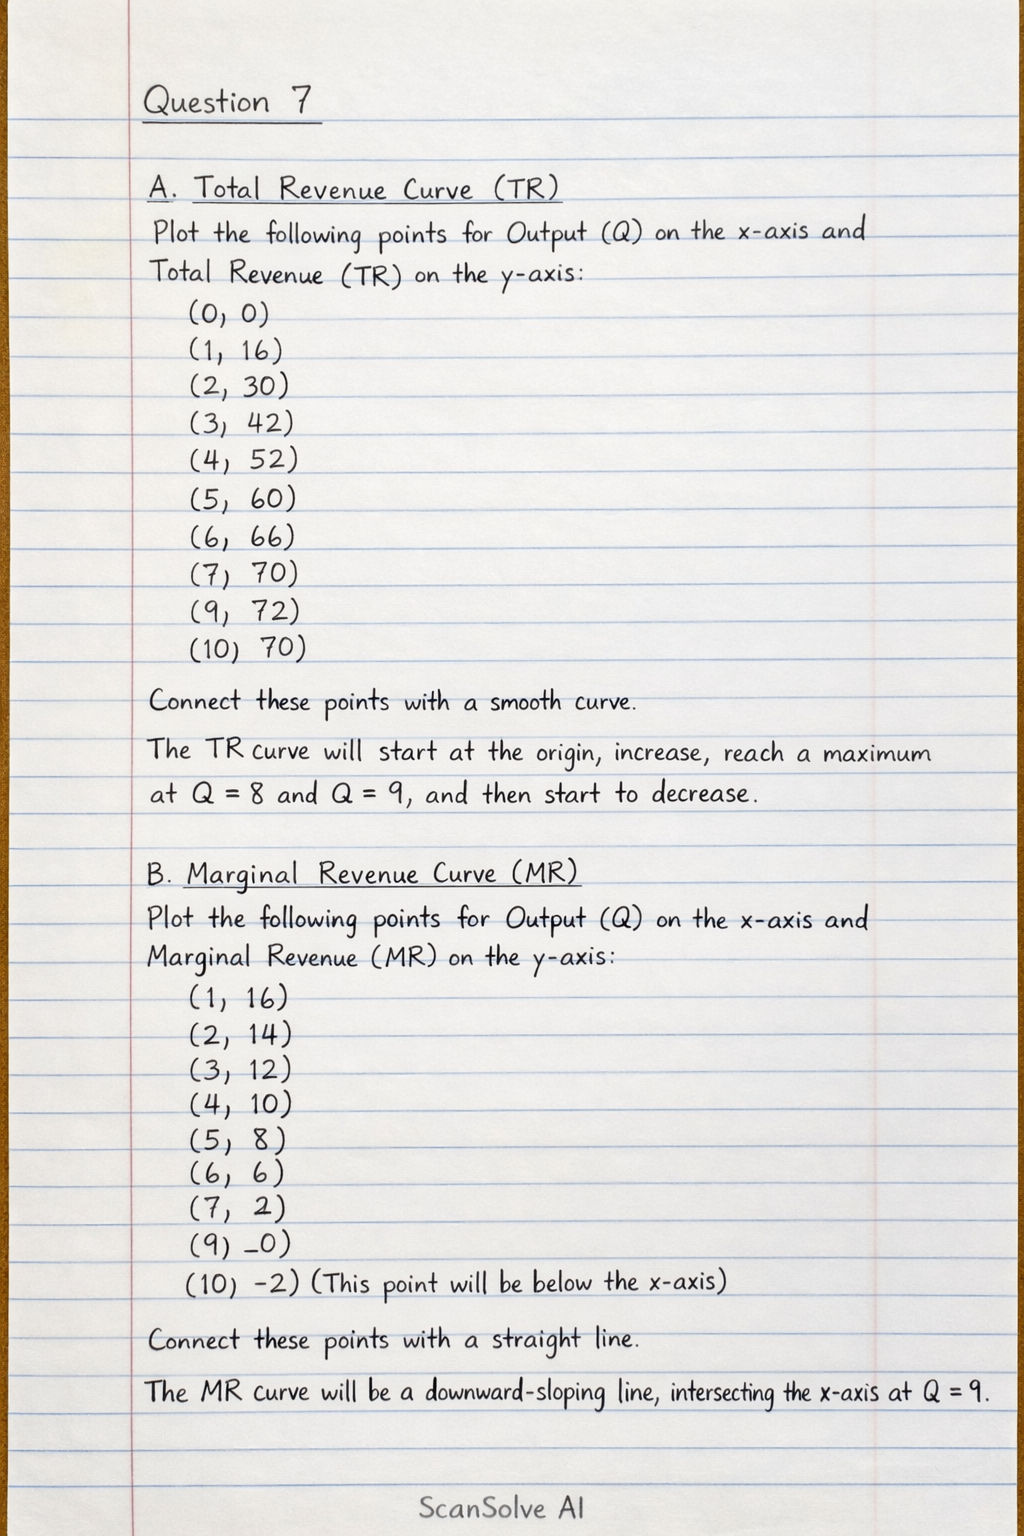
You're on a roll — Question 7 To sketch the curves, we will use the values calculated in the previous question. A. Total Revenue Curve (TR) Plot the following points for Output (Q) on the x-axis and Total Revenue (TR) on the y-axis: (0, 0) (1, 16) (2, 30) (3, 42) (4, 52) (5, 60) (6, 66) (7, 70) (8, 72) (9, 72) (10, 70) Connect these points with a smooth curve. The TR curve will start at the origin, increase, reach a maximum at Q=8 and Q=9, and then start to decrease. B. Marginal Revenue Curve (MR) Plot the following points for Output (Q) on the x-axis and Marginal Revenue (MR) on the y-axis: (1, 16) (2, 14) (3, 12) (4, 10) (5, 8) (6, 6) (7, 4) (8, 2) (9, 0) (10, -2) (This point will be below the x-axis) Connect these points with a straight line. The MR curve will be a downward-sloping line, intersecting the x-axis at Q=9. C. Marginal Cost Curve (MC) Plot the following points for Output (Q) on the x-axis and Marginal Cost (MC) on the y-axis: (1, 8) (2, 5) (3, 2) (4, 2) (5, 1) (6, 4) (7, 8) (8, 10) (9, 14) (10, 16) Connect these points with a smooth curve. The MC curve will initially decrease, reach a minimum between Q=4 and Q=5, and then increase. You should now have three distinct curves drawn on your graph based on these points. What's next?