
How do i plot this on graph paper
English
ScanSolve AI Answer
Step-by-step solution
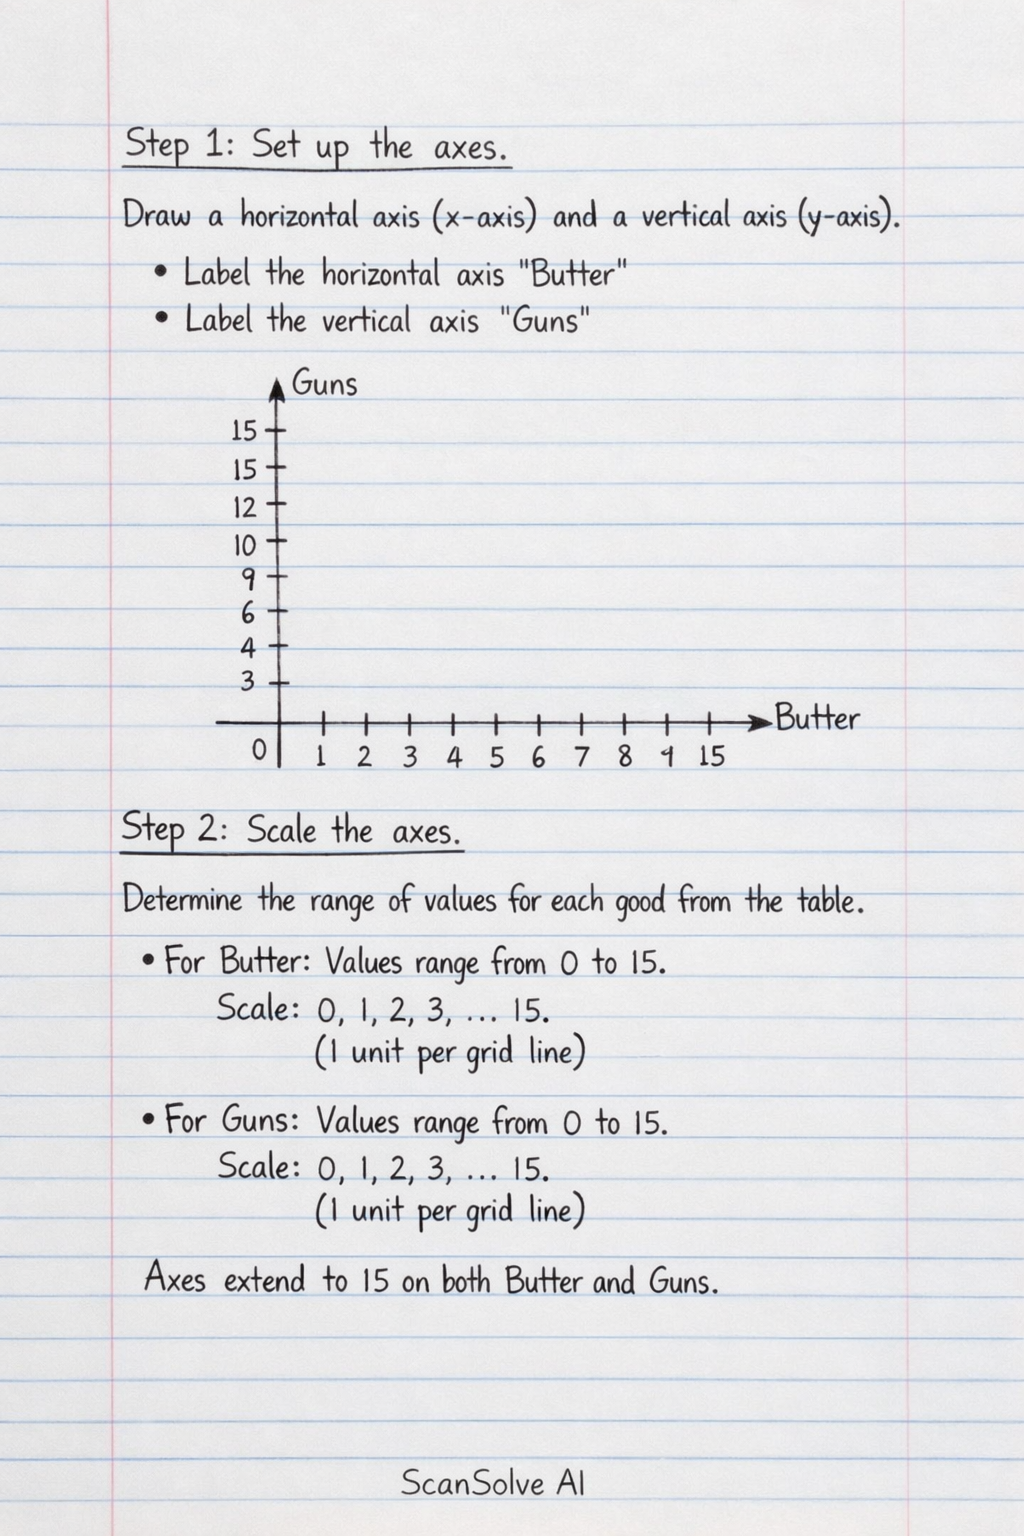
4 stepsSet up the axes.
Draw a horizontal axis (x-axis) and a vertical axis (y-axis) on your graph paper.
- Label the horizontal axis "Butter" (or "Good B").
- Label the vertical axis "Guns" (or "Good G").
Scale the axes.
Determine the range of values for each good from the table.
- For Butter: The values range from 0 to 15. Choose a scale where each grid line represents 1 unit of Butter, or 2 units if you want to spread it out more. Ensure the axis extends at least to 15.
- For Guns: The values range from 0 to 15. Choose a similar scale for the vertical axis, ensuring it extends at least to 15.
Plot the points.
For each point (A, B, C, D, E) from the table, locate its position on the graph:
- Point A: (0 Butter, 15 Guns) - Start at 0 on the Butter axis, then move up to 15 on the Guns axis. Mark this point.
- Point B: (5 Butter, 14 Guns) - Move right to 5 on the Butter axis, then move up to 14 on the Guns axis. Mark this point.
- Point C: (10 Butter, 10 Guns) - Move right to 10 on the Butter axis, then move up to 10 on the Guns axis. Mark this point.
- Point D: (14 Butter, 5 Guns) - Move right to 14 on the Butter axis, then move up to 5 on the Guns axis. Mark this point.
- Point E: (15 Butter, 0 Guns) - Move right to 15 on the Butter axis, then stay at 0 on the Guns axis. Mark this point.
Draw the curve.
Once all points are plotted, draw a smooth curve connecting them from point A to point E. This curve represents the Production Possibility Curve.
Was this helpful?
Still stuck on this one?
Ask a follow-up, and the answer starts from this question.
Got a different question?Ask your own question
More English Questions
Handwritten Step-by-Step Solution
Get this as a handwritten image on WhatsApp — like a tutor wrote it for you.
Try on WhatsApp