
How do I plot my graph?
ScanSolve AI Answer
Step-by-step solution
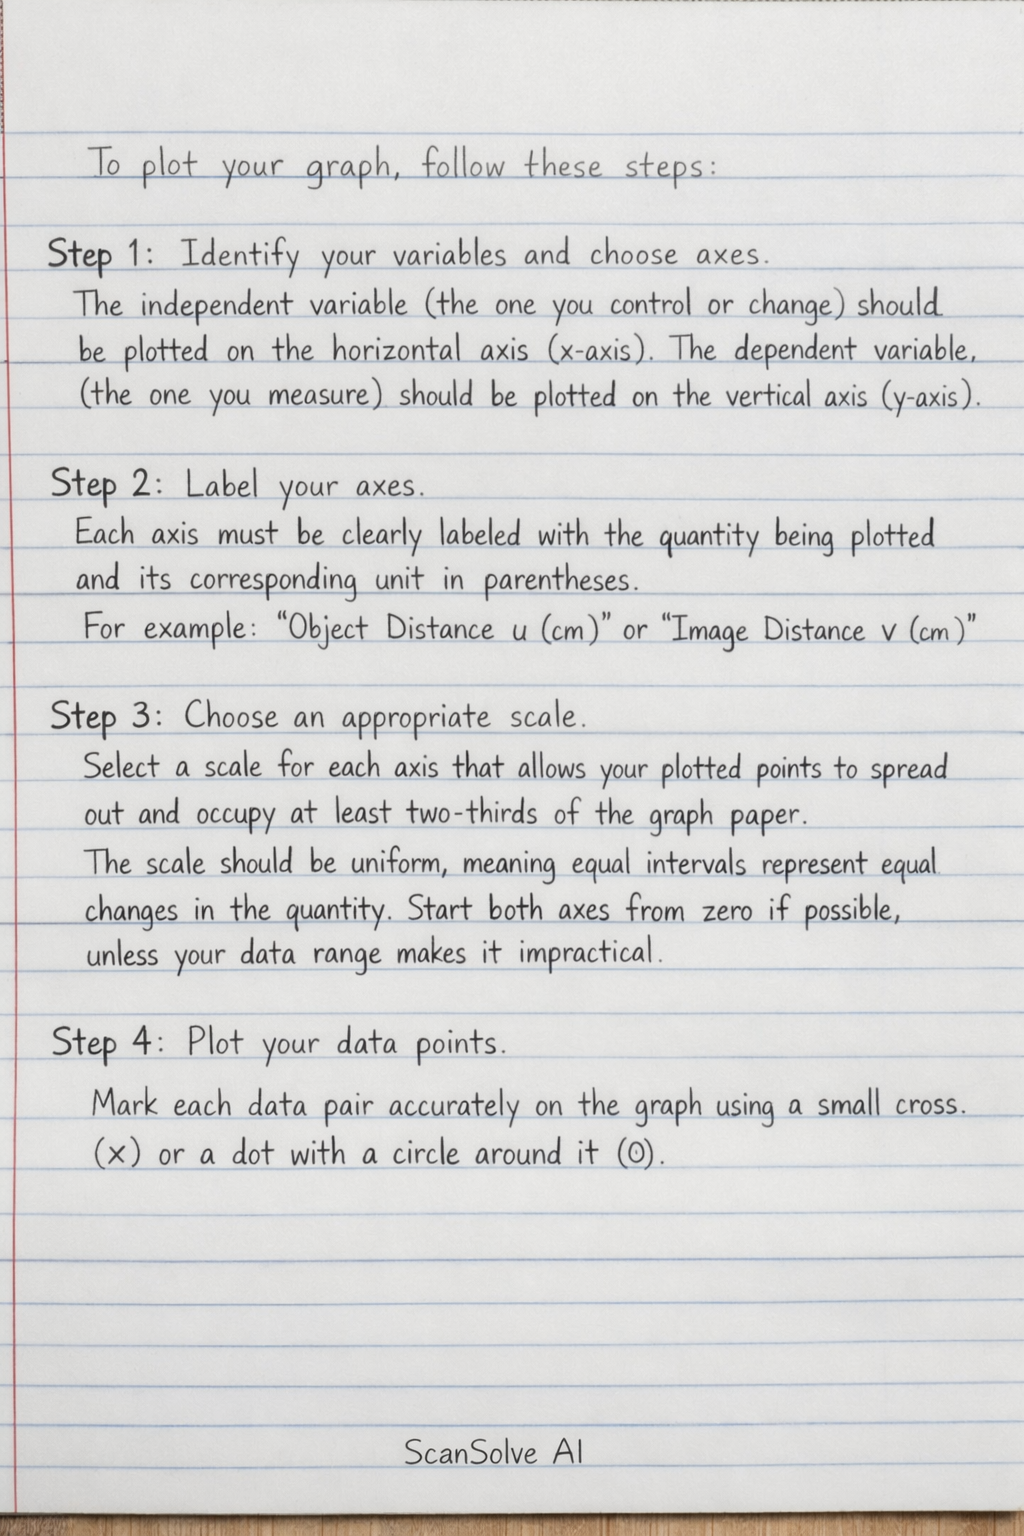
6 stepsTo plot your graph, follow these steps:
Identify your variables and choose axes.
The independent variable (the one you control or change) should be plotted on the horizontal axis (x-axis). The dependent variable (the one you measure) should be plotted on the vertical axis (y-axis).
Label your axes.
Each axis must be clearly labeled with the quantity being plotted and its corresponding unit in parentheses. For example, "Object Distance (cm)" or "Image Distance (cm)".
Choose an appropriate scale.
Select a scale for each axis that allows your plotted points to spread out and occupy at least two-thirds of the graph paper. The scale should be uniform, meaning equal intervals represent equal changes in the quantity. Start both axes from zero if possible, unless your data range makes it impractical.
Plot your data points.
Mark each data pair accurately on the graph using a small cross () or a dot with a circle around it ().
Draw the line of best fit.
After plotting all points, draw a single straight line or a smooth curve that best represents the trend of your data. This line does not necessarily have to pass through every point, but it should have an approximately equal number of points above and below it. Use a ruler for straight lines.
Add a title.
Give your graph a clear and concise title that describes what the graph represents, for example, "Graph of Image Distance against Object Distance ".
Still stuck on this one?
Ask a follow-up, and the answer starts from this question.
More English Questions
Handwritten Step-by-Step Solution
Get this as a handwritten image on WhatsApp — like a tutor wrote it for you.
Try on WhatsApp