
Need example of number line plot -2.8
English
ScanSolve AI Answer
Step-by-step solution
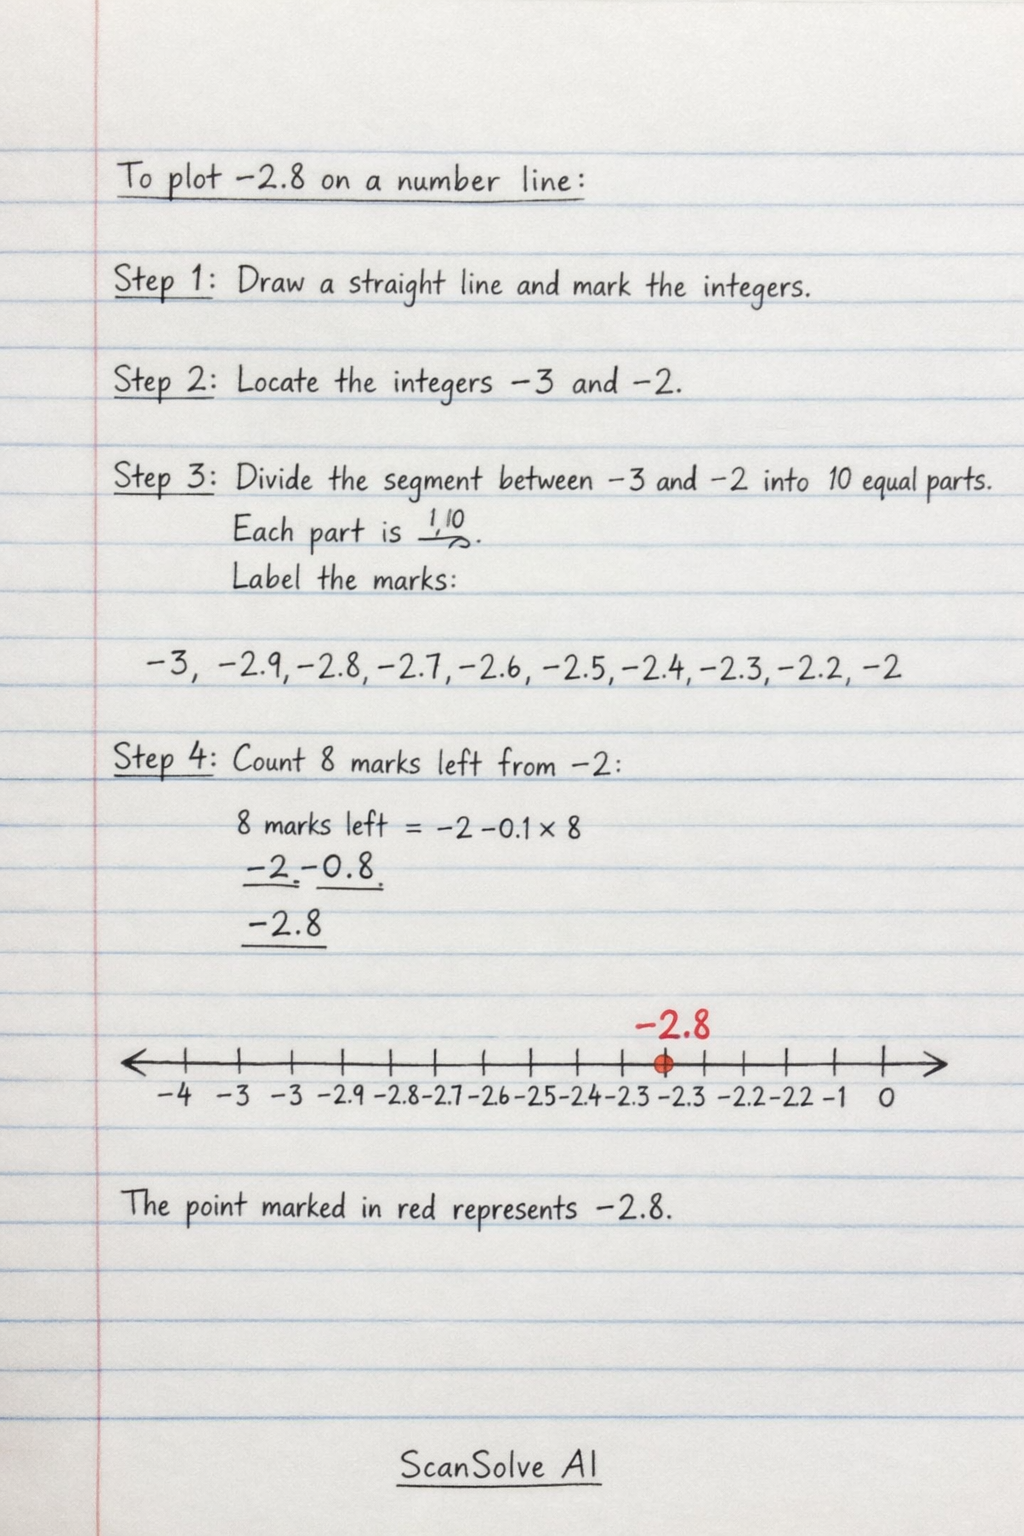
4 stepsTo plot on a number line:
Draw a straight line and mark integers.
Locate the integers and .
Divide the segment between and into 10 equal parts.
Each mark represents a tenth.
Count eight marks to the left from (or two marks to the right from ) to find .
\begin{tikzpicture}
\draw[<->] (-4.5,0) -- (0.5,0);
\foreach \x in {-4,-3,-2,-1,0}
  \draw (\x,0.1) -- (\x,-0.1) node[below] {\x};
\foreach \x in {-2.9,-2.8,-2.7,-2.6,-2.5,-2.4,-2.3,-2.2,-2.1}
  \draw (\x,0.05) -- (\x,-0.05);
\filldraw[red] (-2.8,0) circle (2pt) node[above right] {$-2.8$};
\end{tikzpicture}
The point marked in red represents .
Was this helpful?
Still stuck on this one?
Ask a follow-up, and the answer starts from this question.
Got a different question?Ask your own question
More English Questions
Handwritten Step-by-Step Solution
Get this as a handwritten image on WhatsApp — like a tutor wrote it for you.
Try on WhatsApp