
How to plot a graph that is having numbers like 0.06, 0.12
English
ScanSolve AI Answer
Answer
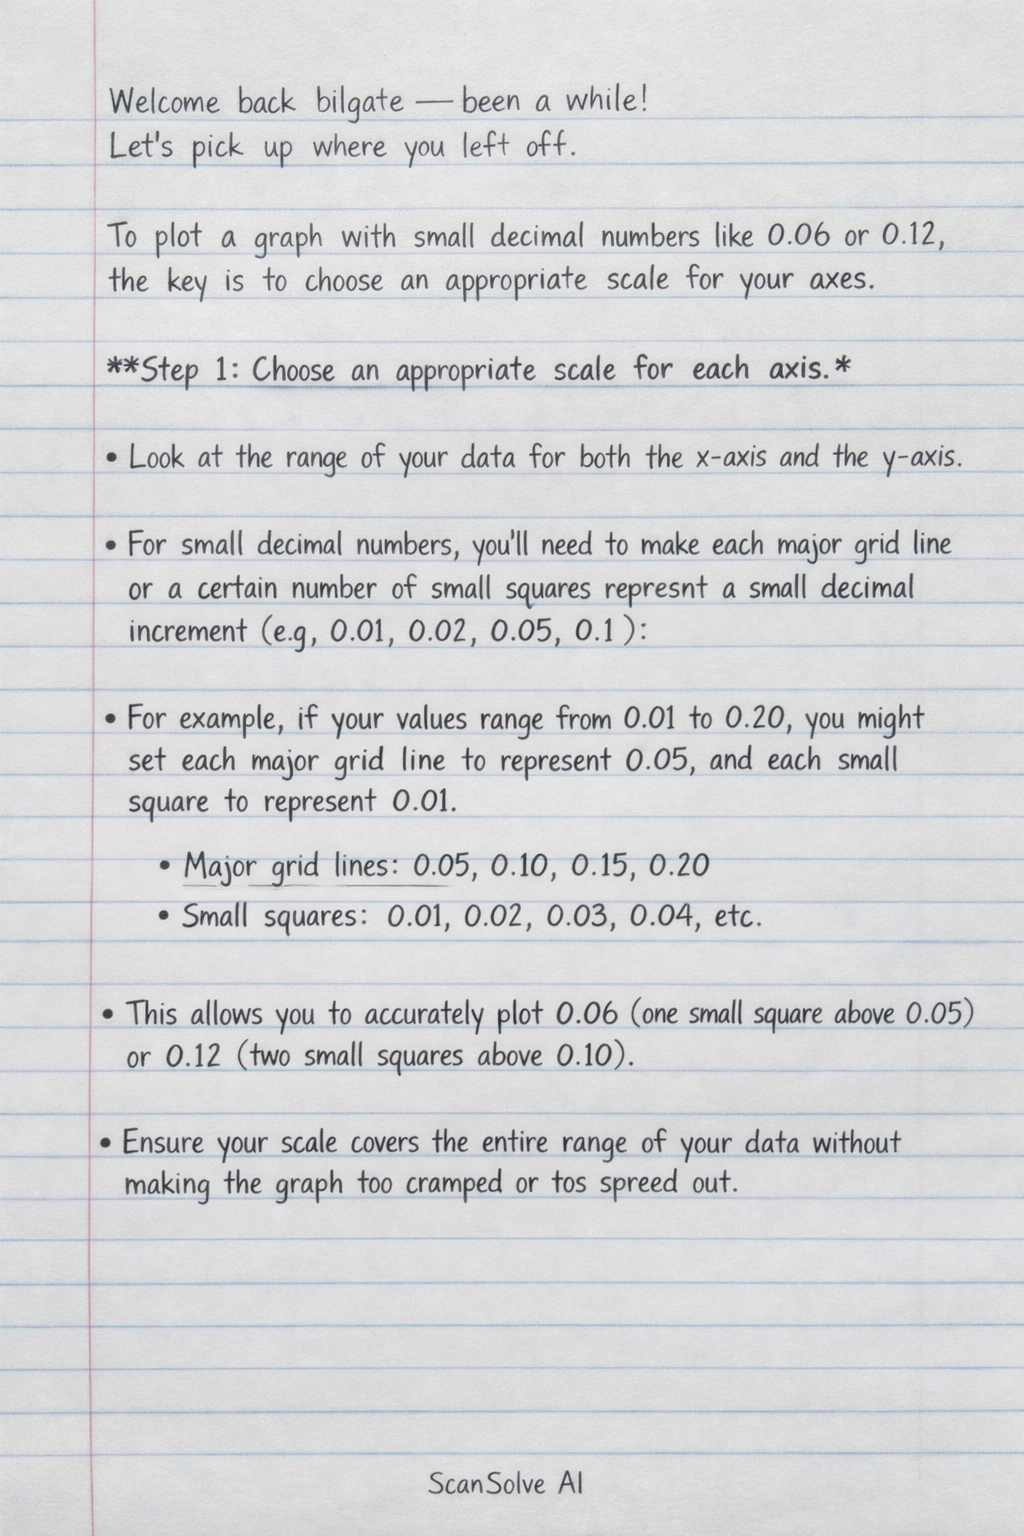
To plot a graph with small decimal numbers like 0.06 or 0.12, the key is to choose an appropriate scale for your axes.
Step-by-step solution
3 stepsChoose an appropriate scale for each axis.
- Look at the range of your data for both the x-axis and the y-axis.
- For small decimal numbers, you'll need to make each major grid line or a certain number of small squares represent a small decimal increment (e.g., 0.01, 0.02, 0.05, 0.1).
- For example, if your values range from 0.01 to 0.20, you might set each major grid line to represent 0.05, and each small square to represent 0.01. This allows you to accurately plot 0.06 (one small square above 0.05) or 0.12 (two small squares above 0.10).
- Ensure your scale covers the entire range of your data without making the graph too cramped or too spread out.
Label your axes clearly.
- Label each axis with the quantity it represents and its units. For example, "Time (s)" for the x-axis and "Displacement (m)" for the y-axis.
- Mark the chosen increments along each axis (e.g., 0, 0.05, 0.10, 0.15, 0.20 on the y-axis).
Plot your data points.
- For each data pair , find the corresponding position on the graph using your chosen scales.
- Mark the point with a small dot or cross.
Example:
Let's say you have the following data points to plot: , , .- X-axis (e.g., Time in seconds): Values are 1, 2, 3. A scale where 1 major grid line = 1 unit would be suitable.
- Y-axis (e.g., Distance in meters): Values are 0.06, 0.12, 0.18.
- If you set 1 major grid line to be 0.10, and there are 5 small squares between major grid lines, then each small square represents .
- To plot 0.06: Go up 3 small squares from 0 (since ).
- To plot 0.12: Go up 6 small squares from 0, or 1 small square above 0.10 (since ).
- To plot 0.18: Go up 9 small squares from 0, or 4 small squares above 0.10 (since ).
By carefully selecting your scale, even small decimal values can be plotted accurately.
Was this helpful?
Still stuck on this one?
Ask a follow-up, and the answer starts from this question.
Got a different question?Ask your own question
More English Questions
Handwritten Step-by-Step Solution
Get this as a handwritten image on WhatsApp — like a tutor wrote it for you.
Try on WhatsApp