
We read your photo as:
Solve and plot a graph
ScanSolve AI Answer
Step-by-step solution
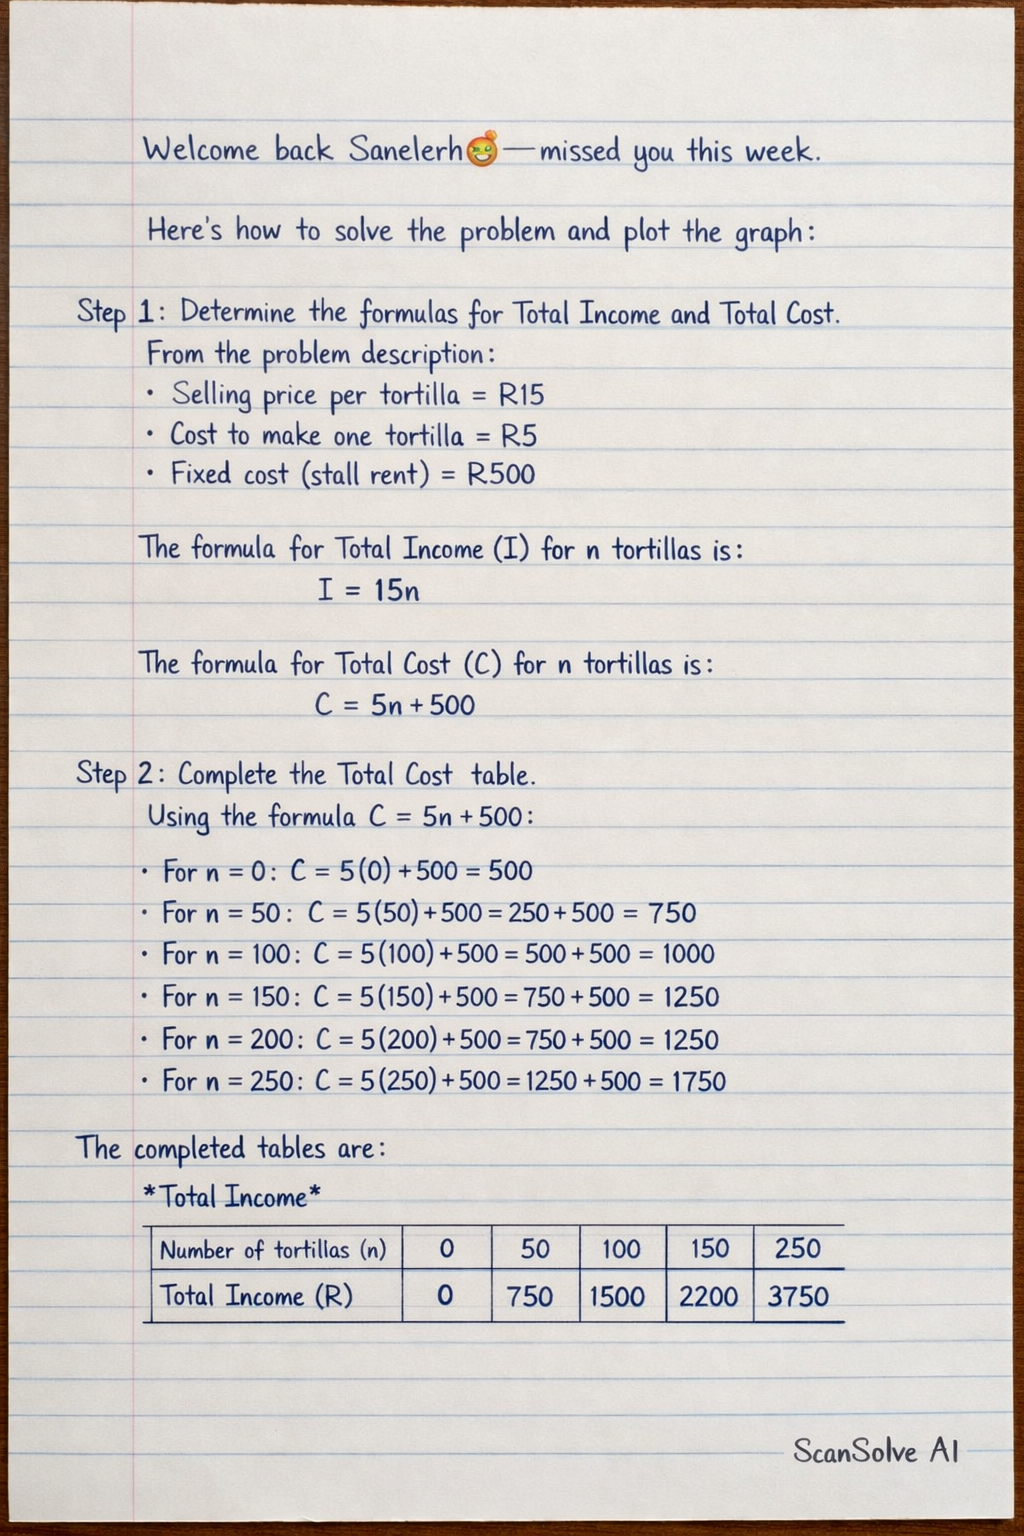
4 stepsHere's how to solve the problem and plot the graph:
Determine the formulas for Total Income and Total Cost.
From the problem description:
- Selling price per tortilla = R15
- Cost to make one tortilla = R5
- Fixed cost (stall rent) = R500
The formula for Total Income (I) for tortillas is:
The formula for Total Cost (C) for tortillas is:
Complete the Total Cost table.
Using the formula :
- For :
- For :
- For :
- For :
- For :
- For :
The completed tables are:
Total Income
Number of tortillas (n) 0 50 100 150 200 250 Total Income (R) 0 750 1500 2250 3000 3750 Total Cost
Number of tortillas (n) 0 50 100 150 200 250 Total Cost (R) 500 750 1000 1250 1500 1750 Prepare data points for plotting.
To plot the graph, you will use the number of tortillas () on the x-axis and the amount in Rands (R) on the y-axis.
Points for Total Income ():
Points for Total Cost ():
Plot the graph.
- Draw a coordinate plane.
- Label the horizontal axis (x-axis) as "Number of Tortillas (n)" and the vertical axis (y-axis) as "Amount (R)".
- Choose an appropriate scale for both axes. For the x-axis, you can use increments of 50. For the y-axis, you can use increments of 500 or 750.
- Plot the points for Total Income and draw a straight line connecting them. This line represents the revenue.
- Plot the points for Total Cost and draw a straight line connecting them. This line represents the total expenses.
- Identify the break-even point, which is where the Total Income line intersects the Total Cost line. At this point, income equals cost, and there is no profit or loss. To find the break-even point: At , and . The break-even point is at (50 tortillas, R750).
The graph will show that for fewer than 50 tortillas, the cost is higher than the income (loss), and for more than 50 tortillas, the income is higher than the cost (profit).
Still stuck on this one?
Ask a follow-up, and the answer starts from this question.
More English Questions
Handwritten Step-by-Step Solution
Get this as a handwritten image on WhatsApp — like a tutor wrote it for you.
Try on WhatsApp