
I mean to say that u should plot a graph with this values
ScanSolve AI Answer
Answer
You've provided the values for the first data set. To plot the graphs and calculate the slopes, I will provide instructions for plotting and then calculate the slope for the first data set. For the second data set, please provide the complete list of values.
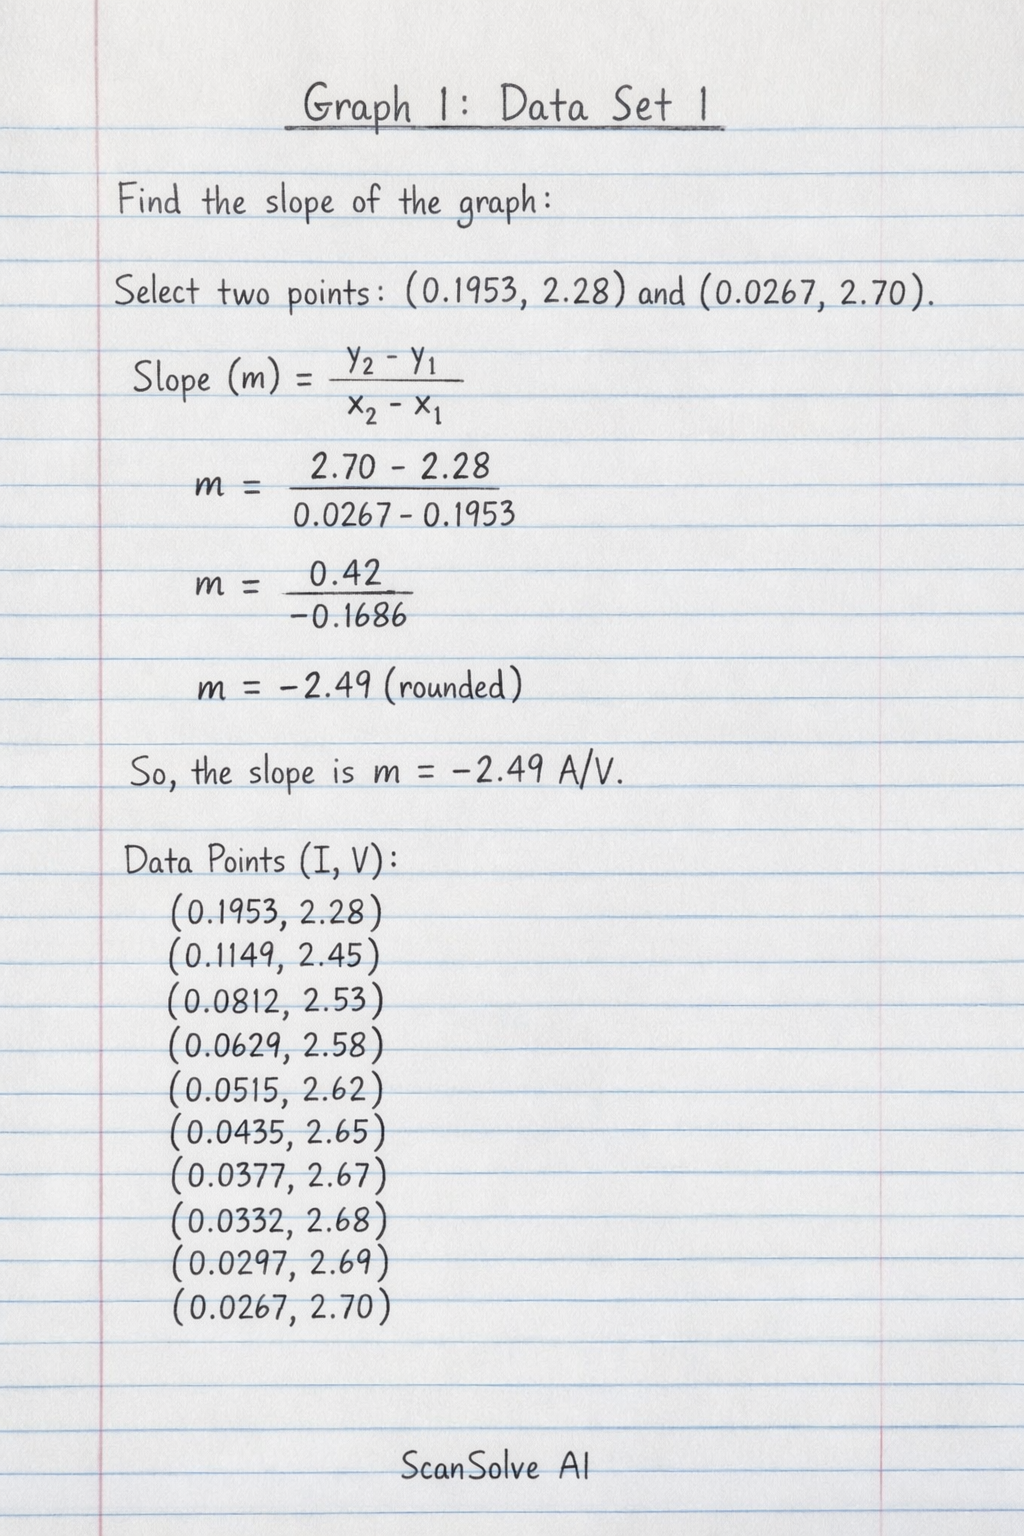
Graph 1: Data Set 1
Data Points (Current in A, Voltage in V):
Instructions for Plotting Graph 1:
- Axes: Draw a horizontal axis (x-axis) for Current () in Amperes (A) and a vertical axis (y-axis) for Voltage () in Volts (V).
- Scale:
- For the x-axis (Current): Choose a scale that accommodates values from to approximately . For example, could represent .
- For the y-axis (Voltage): Choose a scale that accommodates values from approximately to . For example, could represent .
- Plot Points: Plot each pair from the data table on your graph paper.
- Best-Fit Line: Draw a straight line that best fits the plotted points. This line should represent the general trend of the data.
Calculation of Slope () for Graph 1:
We will use the first and last data points to calculate the slope.
Let and .
The slope is given by:
The slope for Data Set 1 is .
Graph 2: Data Set 2
You provided the following partial data for Data Set 2:
To plot this graph and calculate its slope accurately, please provide the complete list of data points for Data Set 2.
Try one yourself
A new problem that tests the same skill.
Still stuck on this one?
Ask a follow-up, and the answer starts from this question.
More English Questions
Handwritten Step-by-Step Solution
Get this as a handwritten image on WhatsApp — like a tutor wrote it for you.
Try on WhatsApp