
We read your photo as:
Drought in lufule
Geography
ScanSolve AI Answer
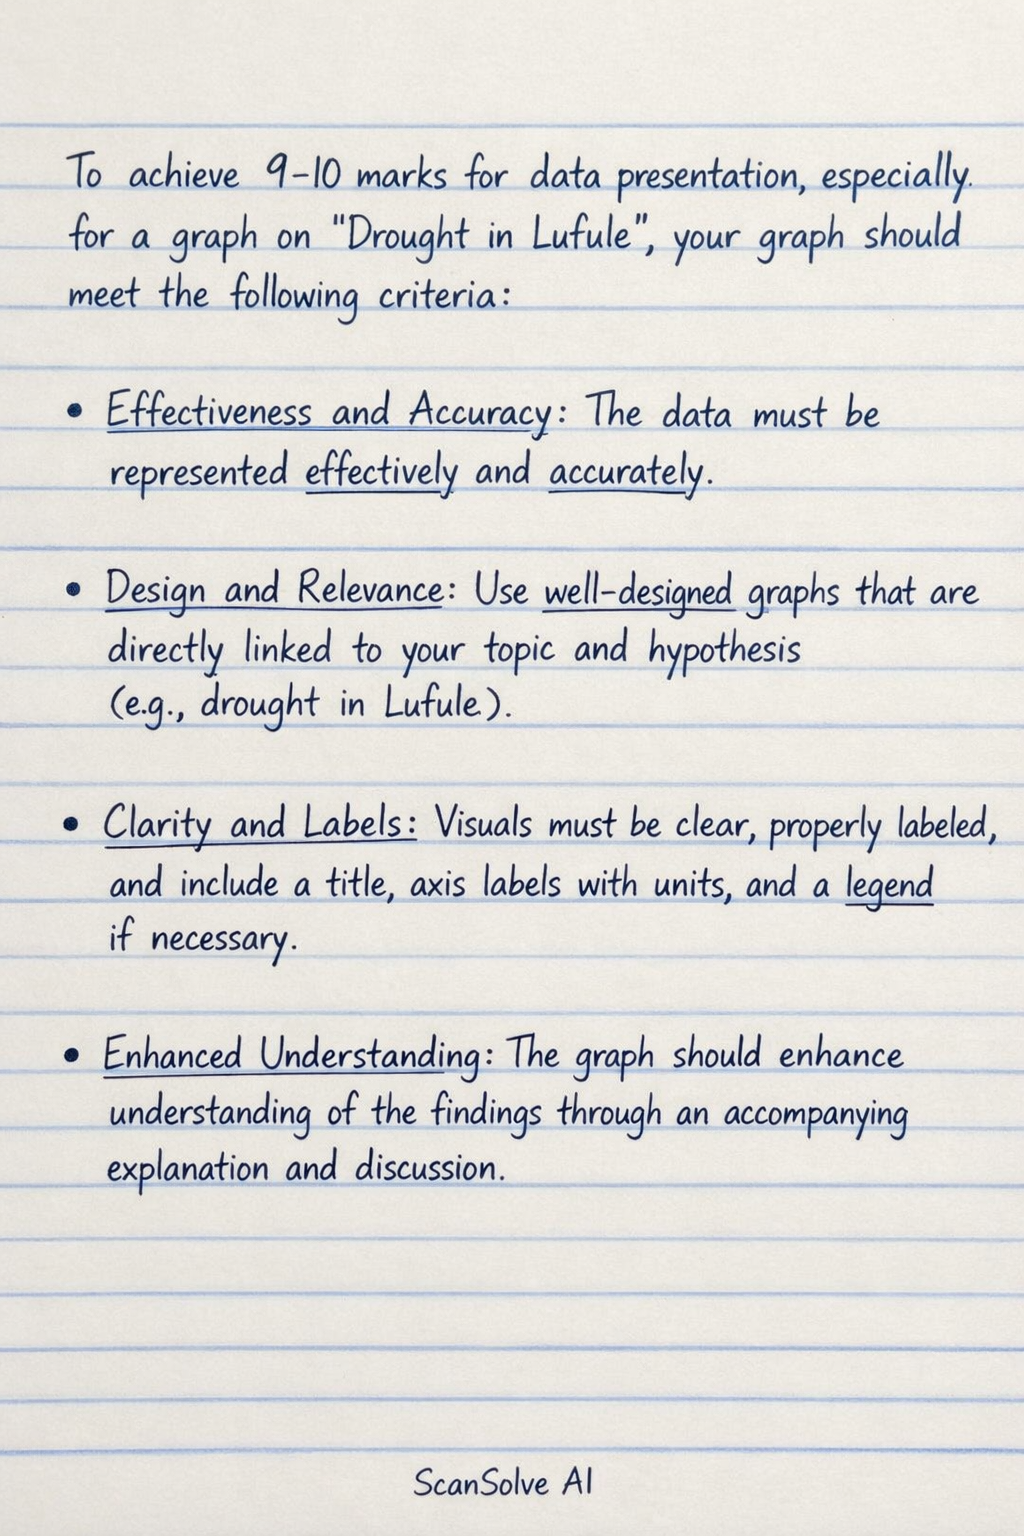
To achieve 9-10 marks for data presentation, especially for a graph on "Drought in Lufule", your graph should meet the following criteria:
- Effectiveness and Accuracy: The data must be represented effectively and accurately.
- Design and Relevance: Use well-designed graphs that are directly linked to your topic and hypothesis (e.g., drought in Lufule).
- Clarity and Labels: Visuals must be clear, properly labelled, and include a title, axis labels with units, and a legend if necessary.
- Enhanced Understanding: The graph should enhance understanding of the findings through an accompanying explanation and discussion.
Was this helpful?
Still stuck on this one?
Ask a follow-up, and the answer starts from this question.
Got a different question?Ask your own question
More Geography Questions
Handwritten Step-by-Step Solution
Get this as a handwritten image on WhatsApp — like a tutor wrote it for you.
Try on WhatsApp