
This geography problem is solved step by step below, with detailed explanations to help you understand the method and arrive at the correct answer.
ScanSolve AI Answer
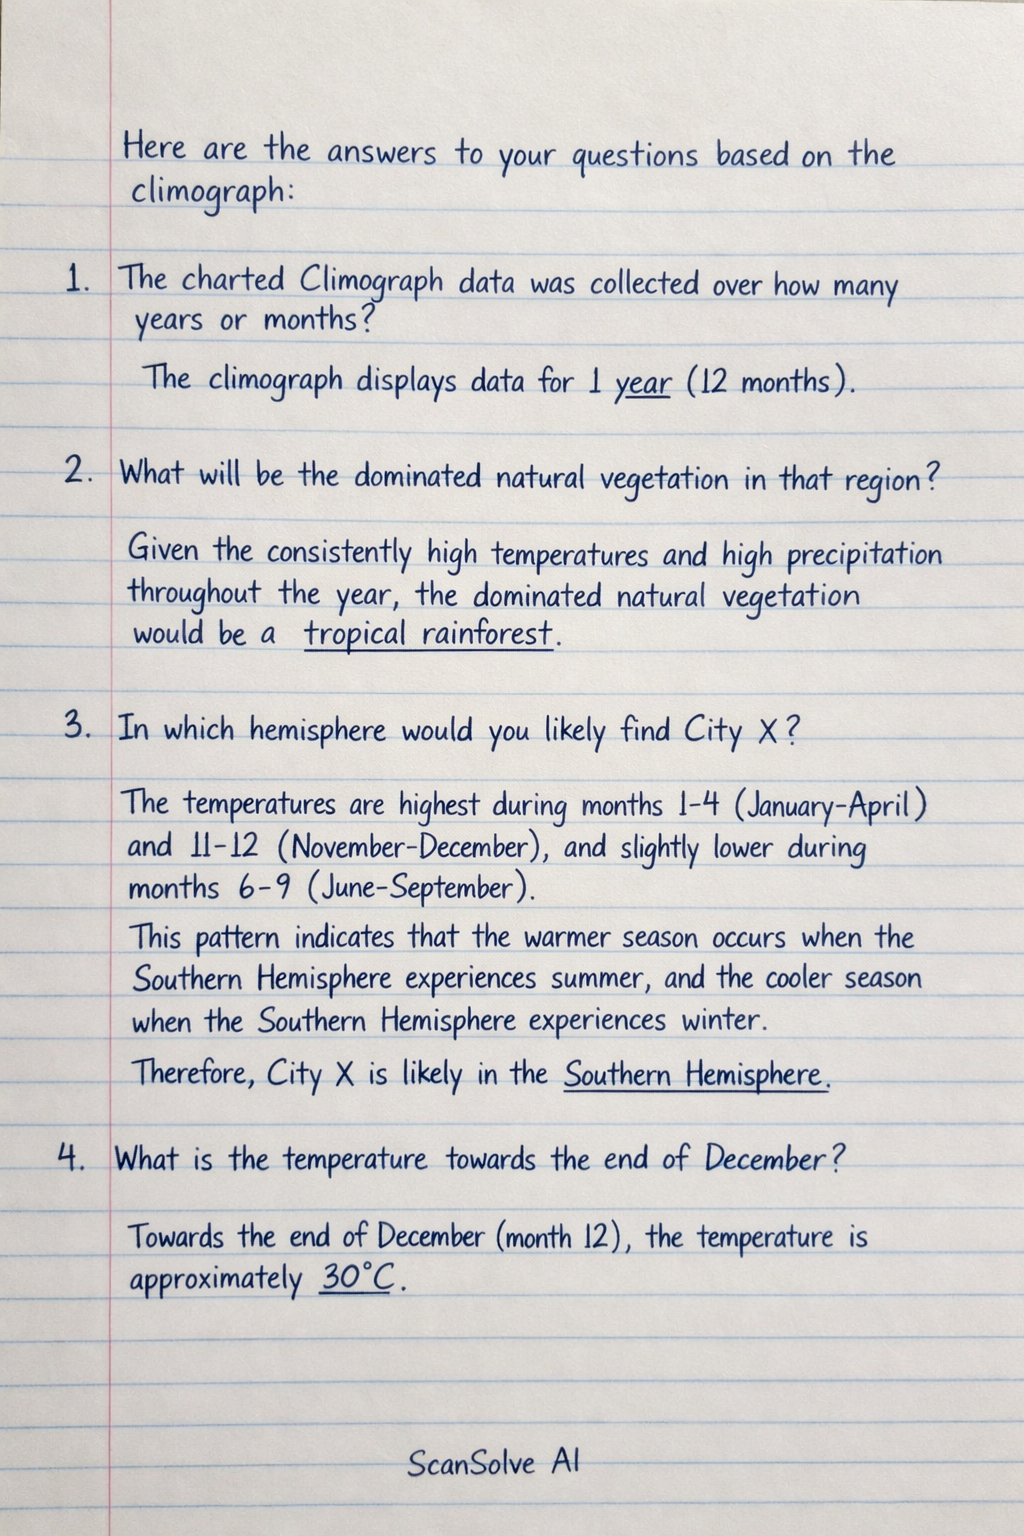
Here are the answers to your questions based on the climograph: 1. The charted Climograph data was collected over how many years or months? The climograph displays data for 1 year (12 months). 2. What will be the dominated natural vegetation in that region? Given the consistently high temperatures and high precipitation throughout the year, the dominated natural vegetation would be a tropical rainforest. 3. In which hemisphere would you likely to find City X? The temperatures are highest during months 1-4 (January-April) and 11-12 (November-December), and slightly lower during months 6-9 (June-September). This pattern indicates that the warmer season occurs when the Southern Hemisphere experiences summer, and the cooler season when the Southern Hemisphere experiences winter. Therefore, City X is likely in the Southern Hemisphere. 4. What is the temperature towards the end of December? Towards the end of December (month 12), the temperature is approximately 30°C. 5. Which Climate Zone does City X belong to? Based on the high temperatures and abundant rainfall year-round, City X belongs to the Tropical Climate Zone. Send me the next one 📸