
We read your photo as:
On the provided topographic map, draw a cross-section of the land along the line AB, indicating key elevation points and contour lines.
ScanSolve AI Answer
Answer
Step-by-step solution
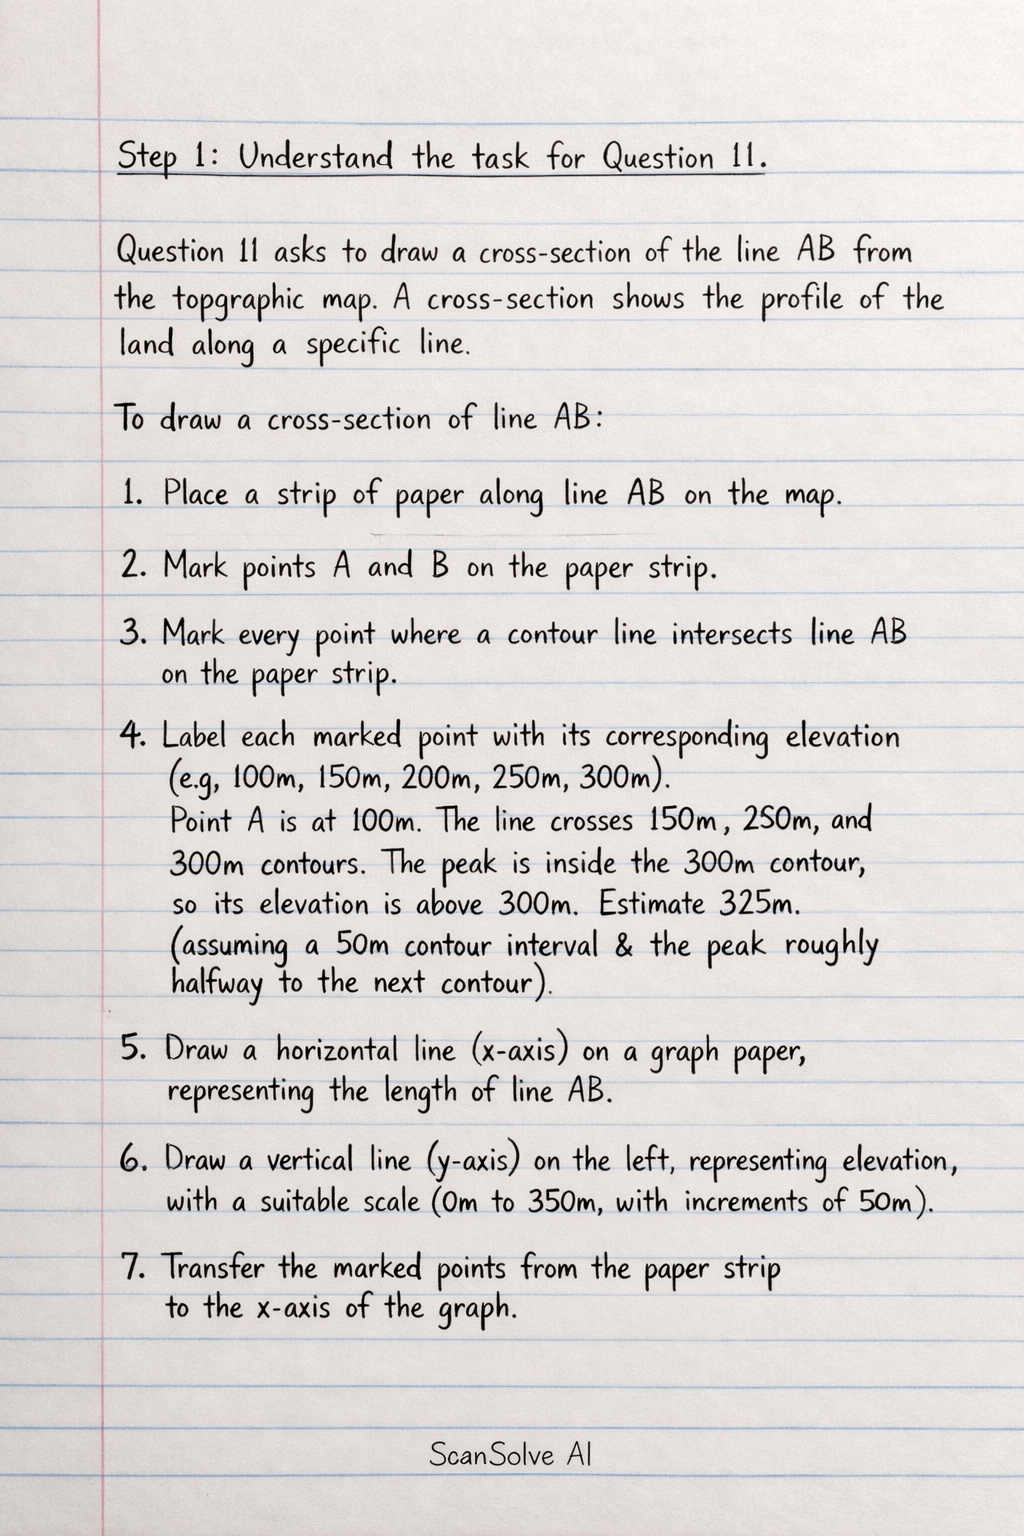
4 stepsStep 1: Understand the task for Question 11.
Part 11· 1 step
asks to draw a cross-section of the line AB from the topographic map. A cross-section shows the profile of the land along a specific line.
To draw a cross-section of line AB:
- Place a strip of paper along line AB on the map.
- Mark points A and B on the paper strip.
- Mark every point where a contour line intersects line AB on the paper strip.
- Label each marked point with its corresponding elevation (e.g., 100m, 150m, 200m, 250m, 300m). Point A is at 100m. The line crosses 150m, 200m, 250m, and 300m contours. The peak is inside the 300m contour, so its elevation is above 300m (e.g., 325m, assuming a 50m contour interval and the peak being roughly halfway to the next contour).
- Draw a horizontal line (x-axis) on a graph paper, representing the length of line AB.
- Draw a vertical line (y-axis) on the left, representing elevation, with a suitable scale (e.g., from 0m to 350m, with increments of 50m).
- Transfer the marked points from the paper strip to the x-axis of the graph.
- For each point, plot its corresponding elevation on the graph.
- Connect the plotted points with a smooth line to create the profile of the land along AB.
The resulting cross-section would show an upward slope from point A (100m), steadily increasing in elevation as it crosses the 150m, 200m, 250m, and 300m contour lines, reaching a peak (above 300m), and then descending slightly towards the end of the line segment B (if B is after the peak).
Identify the given information for Question 12*.
Part 12
asks to calculate the gradient of the slope from point C to point D.
The formula for gradient is given as:
Determine the Vertical Interval (VI)*.
Point C is on the 100m contour line.
Point D is on the 200m contour line.
The vertical interval is the difference in elevation between point D and point C.Determine the Horizontal Distance (HD)*.
The map includes a scale bar indicating 500m.
By visual estimation from the image, the length of the line segment CD is approximately half the length of the 500m scale bar.
Therefore, the horizontal distance between C and D is estimated to be:Calculate the Gradient*.
Now, substitute the values of the Vertical Interval and Horizontal Distance into the gradient formula.
The gradient can be expressed as a ratio.
The gradient of the slope from point C to point D is .
Try one yourself
A new problem that tests the same skill.
Still stuck on this one?
Ask a follow-up, and the answer starts from this question.
More Geography Questions
Handwritten Step-by-Step Solution
Get this as a handwritten image on WhatsApp — like a tutor wrote it for you.
Try on WhatsApp