
We read your photo as:
Cash Crops Production in East Africa (2022)
ScanSolve AI Answer
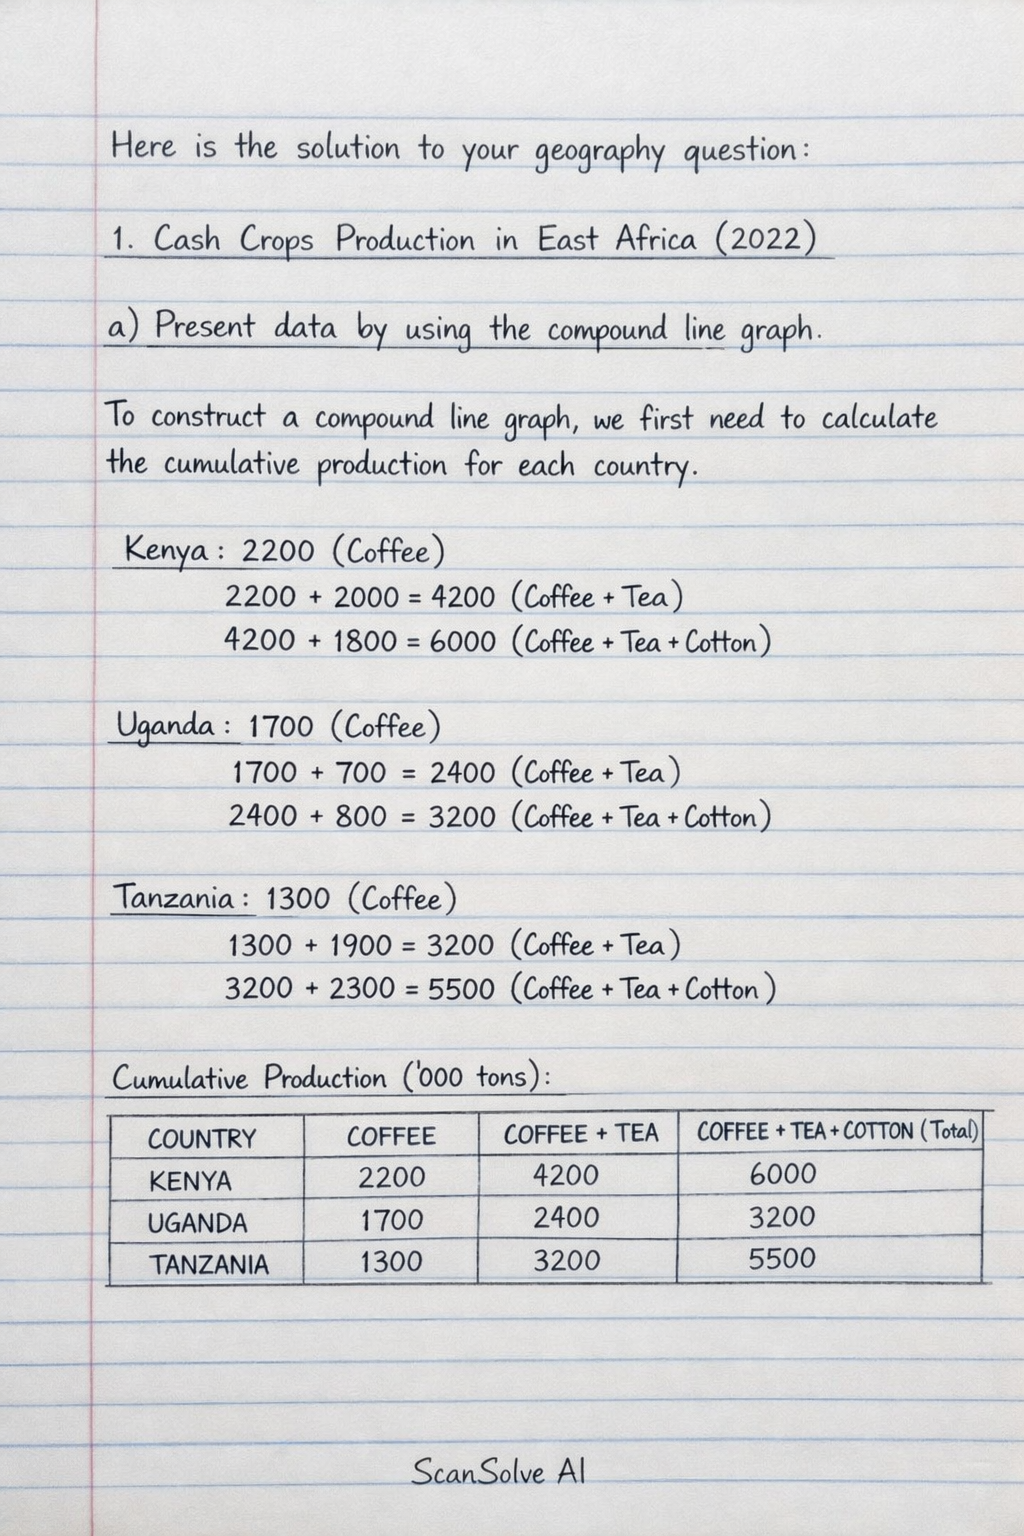
Here is the solution to your geography question:
1. Cash Crops Production in East Africa (2022)
a) Present data by using the compound line graph.
To construct a compound line graph, we first need to calculate the cumulative production for each country.
Cumulative Production ('000 tons):
| COUNTRY | COFFEE | COFFEE + TEA | COFFEE + TEA + COTTON (Total) |
|---|---|---|---|
| KENYA | 2200 | 4200 | 6000 |
| UGANDA | 1700 | 2400 | 3200 |
| TANZANIA | 1300 | 3200 | 5500 |
Construction of the Compound Line Graph:
- Draw a horizontal axis (X-axis) and label it "Countries". Mark points for Kenya, Uganda, and Tanzania.
- Draw a vertical axis (Y-axis) and label it "Production ('000 tons)". Scale it from 0 to at least 6000.
- Plot the first set of points for Coffee production:
- Kenya: (Kenya, 2200)
- Uganda: (Uganda, 1700)
- Tanzania: (Tanzania, 1300) Connect these points with a line and label it "Coffee".
- Plot the second set of points for Coffee + Tea production:
- Kenya: (Kenya, 4200)
- Uganda: (Uganda, 2400)
- Tanzania: (Tanzania, 3200) Connect these points with a second line and label it "Coffee + Tea".
- Plot the third set of points for the total production (Coffee + Tea + Cotton):
- Kenya: (Kenya, 6000)
- Uganda: (Uganda, 3200)
- Tanzania: (Tanzania, 5500) Connect these points with a third line and label it "Total Production".
- Include a clear legend to distinguish between the three lines (Coffee, Coffee + Tea, Total Production).
- Give the graph an appropriate title, e.g., "Cash Crops Production in East Africa, 2022".
b) State two (2) advantages and two (2) disadvantages of the method used.
Advantages of a Compound Line Graph:
- It clearly shows the total production for each country, allowing for easy comparison of overall output.
- It effectively illustrates the contribution of each component (crop) to the total production across different countries.
Disadvantages of a Compound Line Graph:
- It can be difficult to read the exact values for individual components (like Tea or Cotton) as they are represented by the vertical distance between two lines, rather than directly from the axis.
- The graph can become cluttered and confusing if there are too many components or categories, making it hard to interpret.
c) Suggest other three (3) methods which can be used to present the same data.
Three other methods to present this data are:
- Multiple Bar Graph (or Grouped Bar Graph)
- Component Bar Graph (or Stacked Bar Graph)
- Pie Charts (one for each country)
Still stuck on this one?
Ask a follow-up, and the answer starts from this question.
More History Questions
Handwritten Step-by-Step Solution
Get this as a handwritten image on WhatsApp — like a tutor wrote it for you.
Try on WhatsApp