
Question 1 is compulsory. Answer three other questions. Credit will be given for clear diagrams and well-labeled sketches where necessary. Time: 2 hours 30 minutes SECTION A (Compulsory) Question 1 Study the table below showing average monthly rainfall and temperature for a tropical station. Month J F M A M J J A S O N D Rainfall (mm) 18 42 85 140 220 310 420 390 320 210 95 30 Temperature (°C) 28 29 29 28 27 26 25 25 26 27 28 28 Questions a) Calculate: i. The annual rainfall total. (2 marks) ii. The annual temperature range. (2 marks) b) Draw a simple climatic graph using the data above. (8 marks) c) Describe the rainfall pattern shown in the table. (4 marks) d) Explain two factors responsible for the rainfall pattern. (4 marks) e) Identify the climatic region represented by the data. Give one reason. (2 marks) [Total: 22 marks] SECTION B Question 2 — Rocks and Weathering a) Distinguish between: i. Igneous rocks and sedimentary rocks. (4 marks) ii. Physical weathering and chemical weathering. (4 marks) b) Explain how exfoliation takes place in tropical desert regions. (6 marks) c) Describe three effects of weathering on human activities. (6 marks) Question 3 — Vulcanicity and Earth Movements a) What is vulcanicity? (2 marks) b) With the aid of a clearly labeled diagram, describe the formation of a volcanic cone. (8 marks) c) Explain three positive effects of volcanic activity on man. (6 marks) d) State four negative effects of earthquakes. (4 marks) Question 4 — Rivers a) Define: i. Watershed (2 marks) ii. River capture (2 marks) b) Describe the main characteristics of the upper course of a river. (6 marks) c) Explain the formation of: i. Waterfalls (4 marks) ii. Oxbow lakes (6 marks) Question 5 — Coastlines a) Differentiate between: i. Erosion and deposition along the coast. (4 marks) ii. Concordant and discordant coastlines. (4 marks) b) Explain how waves erode the coastline. (6 marks) c) Describe the formation of spits and lagoons. (6 marks) Question 6 — Climate and Vegetation a) State four characteristics of the equatorial climate. (4 marks) b) Explain how relief influences climate. (6 marks) c) Describe the characteristics of tropical rainforest vegetation. (6 marks) d) Explain two ways in which man destroys natural vegetation. (4 marks) Question 7 — Soils a) What is soil? (2 marks) b) Name and describe the three main soil horizons. (6 marks) c) Explain four factors influencing soil formation. (8 marks) d) State four methods of soil conservation. (4 marks) Question 8 — Oceans and Relief a) Distinguish between continental shelf and continental slope. (4 marks) b) Explain the formation of fold mountains. (6 marks) c) Describe the importance of oceans to man. (6 marks) d) Name four major ocean currents of the world. (4 marks)
ScanSolve AI Answer
Answers
2 partsStep-by-step solution
3 stepsPart 1
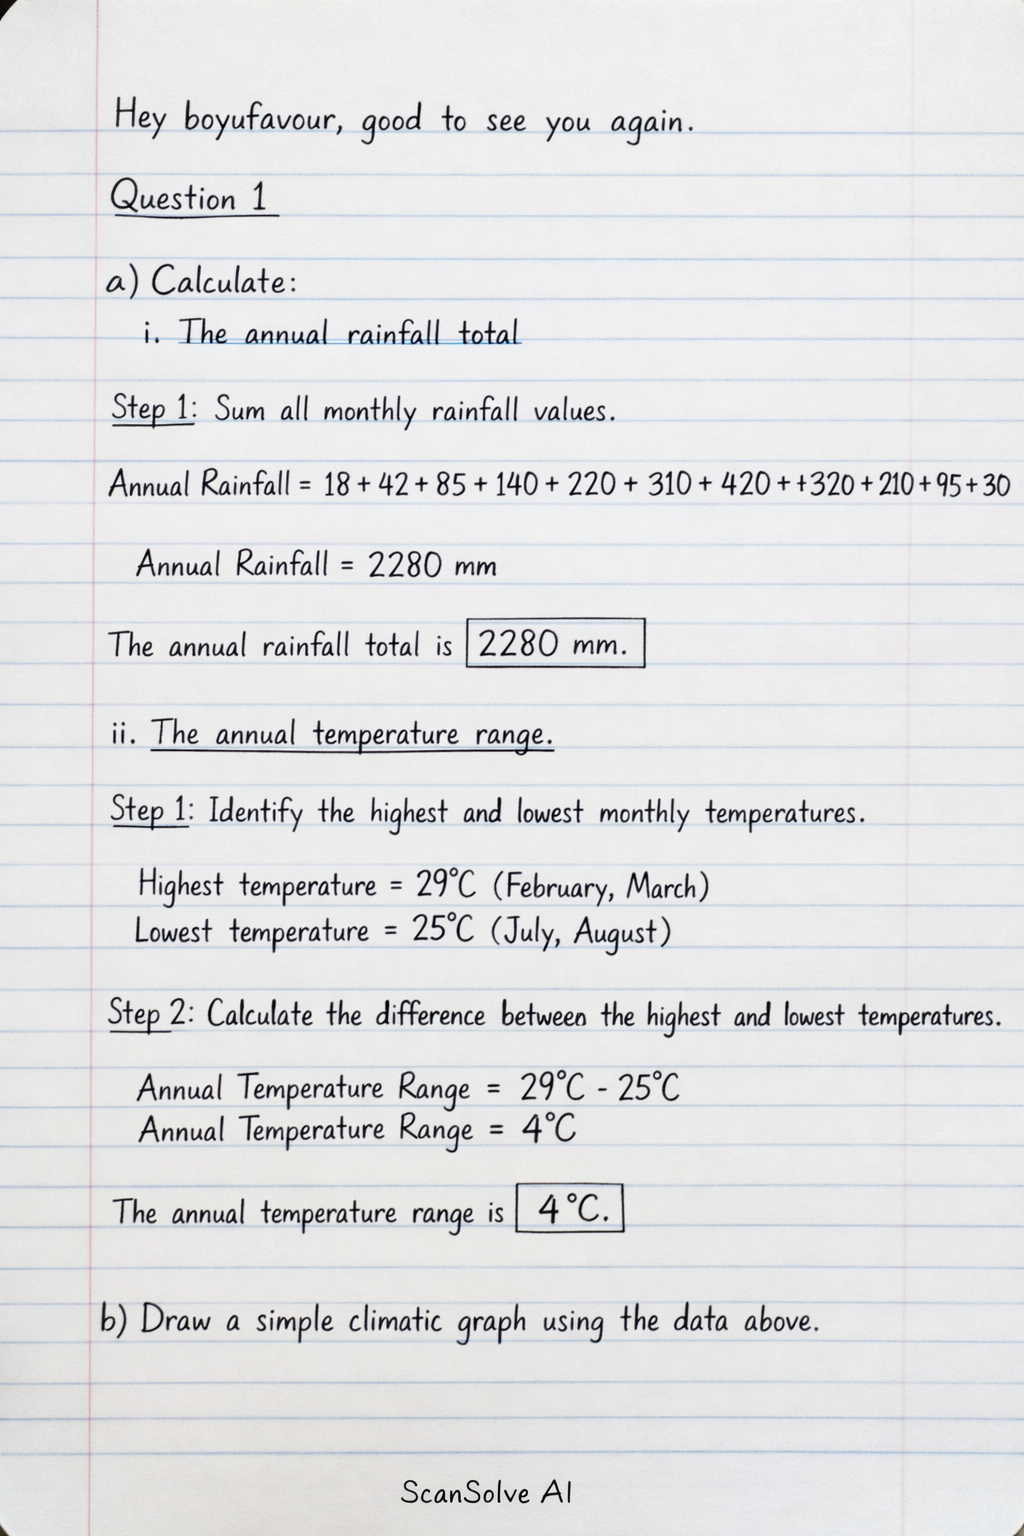
Part a(i)
The annual rainfall total.
Calculate
Sum all monthly rainfall values.
The annual rainfall total is .
Part a(ii)
The annual temperature range.
Identify the highest and lowest monthly temperatures.
Highest temperature = (February, March)
Lowest temperature = (July, August)Calculate the difference between the highest and lowest temperatures.
The annual temperature range is .
Part b
Draw a simple climatic graph using the data above.
To draw a simple climatic graph (also known as a climograph):
- Draw a horizontal X-axis for the months (J, F, M, A, M, J, J, A, S, O, N, D).
- Draw two vertical Y-axes: one on the left for temperature in degrees Celsius () and one on the right for rainfall in millimeters (mm).
- Plot the monthly temperatures as a line graph, connecting the points with a smooth curve. The temperature scale should range from about to .
- Plot the monthly rainfall as a bar graph, with each bar centered over its respective month. The rainfall scale should range from 0 mm to about 450 mm.
- Give the graph a clear title, such as "Climatic Graph for a Tropical Station."
Part c
Describe the rainfall pattern shown in the table.
The rainfall pattern shows a distinct wet season and a dry season. Rainfall is low during the early months of the year (January-February) and late months (November-December), with the lowest rainfall in January (18 mm). Rainfall gradually increases from March, reaching its peak in the summer months of July (420 mm) and August (390 mm). After August, rainfall steadily decreases towards the end of the year. This indicates a single peak of rainfall during the summer, followed by a prolonged dry period in winter.
Part d
Explain two factors responsible for the rainfall pattern.
- Movement of the Inter-Tropical Convergence Zone (ITCZ): The ITCZ is a belt of low pressure that follows the apparent movement of the sun. As the sun moves northward towards the Tropic of Cancer during the Northern Hemisphere summer (June-August), the ITCZ brings convectional rainfall to the region, resulting in the peak rainfall observed in July and August.
- Convectional Rainfall: High temperatures throughout the year, especially during the summer months, lead to intense heating of the land surface. This causes rapid evaporation and the rising of warm, moist air, which cools, condenses, and forms cumulonimbus clouds, resulting in heavy convectional downpours characteristic of tropical regions.
Part e
Identify the climatic region represented by the data. Give one reason.
The climatic region represented by the data is a Tropical Monsoon climate.
Reason: The data shows consistently high temperatures throughout the year with a small annual range (), a very high annual rainfall total (2280 mm), and a distinct wet season (summer peak in July/August) followed by a relatively dry season. These characteristics are typical of a Tropical Monsoon climate.
Try one yourself
A new problem that tests the same skill.
Still stuck on this one?
Ask a follow-up, and the answer starts from this question.
More Law Questions
Handwritten Step-by-Step Solution
Get this as a handwritten image on WhatsApp — like a tutor wrote it for you.
Try on WhatsApp