
We read your photo as:
A mobile phone plan costs R20 per month plus R2.50 per minute. Calculate the total cost for various minutes and describe the relationship.
ScanSolve AI Answer
Answer
Step-by-step solution
2 stepsPart 1· 2 steps
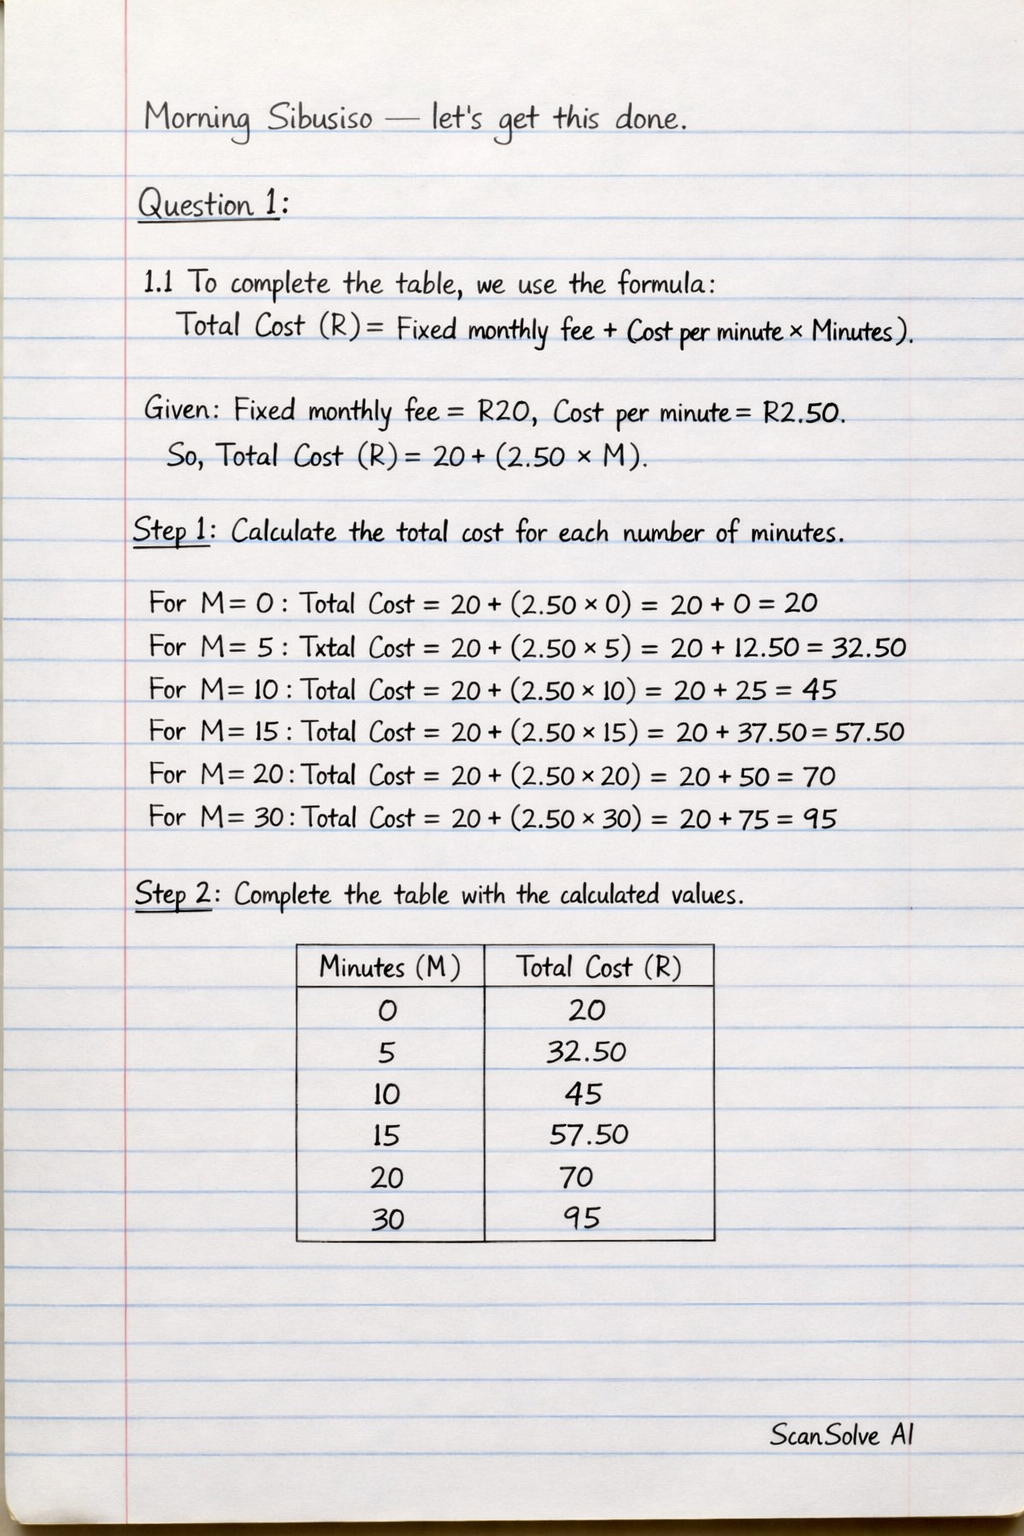
1.1 To complete the table, we use the formula: Total Cost (R) = Fixed monthly fee + (Cost per minute Minutes).
Given: Fixed monthly fee = R20, Cost per minute = R2.50.
So, Total Cost (R) = .
Calculate the total cost for each number of minutes.
For : Total Cost
For : Total Cost
For : Total Cost
For : Total Cost
For : Total Cost
For : Total CostComplete the table with the calculated values.
\begin{tabular}{|c|c|}
\hline
Minutes (M) & Total Cost (R) \\
\hline
0 & 20 \\
5 & 32.50 \\
10 & 45 \\
15 & 57.50 \\
20 & 70 \\
30 & 95 \\
\hline
\end{tabular}
Part 2
2.1 Describe how the total cost changes as minutes increase.
As the number of minutes increases, the total cost also increases. For every additional minute, the total cost increases by a constant amount.
2.2 What is the cost per additional minute?
The cost per additional minute is given in the problem description.
The cost per additional minute is .
2.3 Is the relationship increasing or decreasing? Explain.
The relationship is increasing. As the number of minutes used increases, the total cost also increases because there is a positive cost associated with each additional minute.
Part 3
3.1 Draw a graph showing the relationship between minutes and total cost.
I cannot draw a graph directly, but here are the instructions and points you need to plot:
- Title: Total Cost vs. Minutes for a Prepaid Plan
- Correct labels:
- X-axis: Minutes (M)
- Y-axis: Total Cost (R)
- Suitable scale: Choose a scale that allows all points to fit comfortably on your graph paper. For example, for minutes, you could use 1 unit = 5 minutes. For total cost, you could use 1 unit = R10.
- At least 5 plotted points: Use the following points from the completed table:
- $(0, 20)$
- $(5, 32.50)$
- $(10, 45)$
- $(15, 57.50)$
- $(20, 70)$
- $(30, 95)$
- Straight line: Connect the plotted points with a straight line, as this is a linear relationship.
Try one yourself
A new problem that tests the same skill.
Still stuck on this one?
Ask a follow-up, and the answer starts from this question.
More Mathematics Questions
Handwritten Step-by-Step Solution
Get this as a handwritten image on WhatsApp — like a tutor wrote it for you.
Try on WhatsApp