
This mathematics problem involves applying core mathematical principles and formulas. Below you will find a complete step-by-step solution with detailed explanations for each step, helping you understand not just the answer but the method behind it.
ScanSolve AI Answer
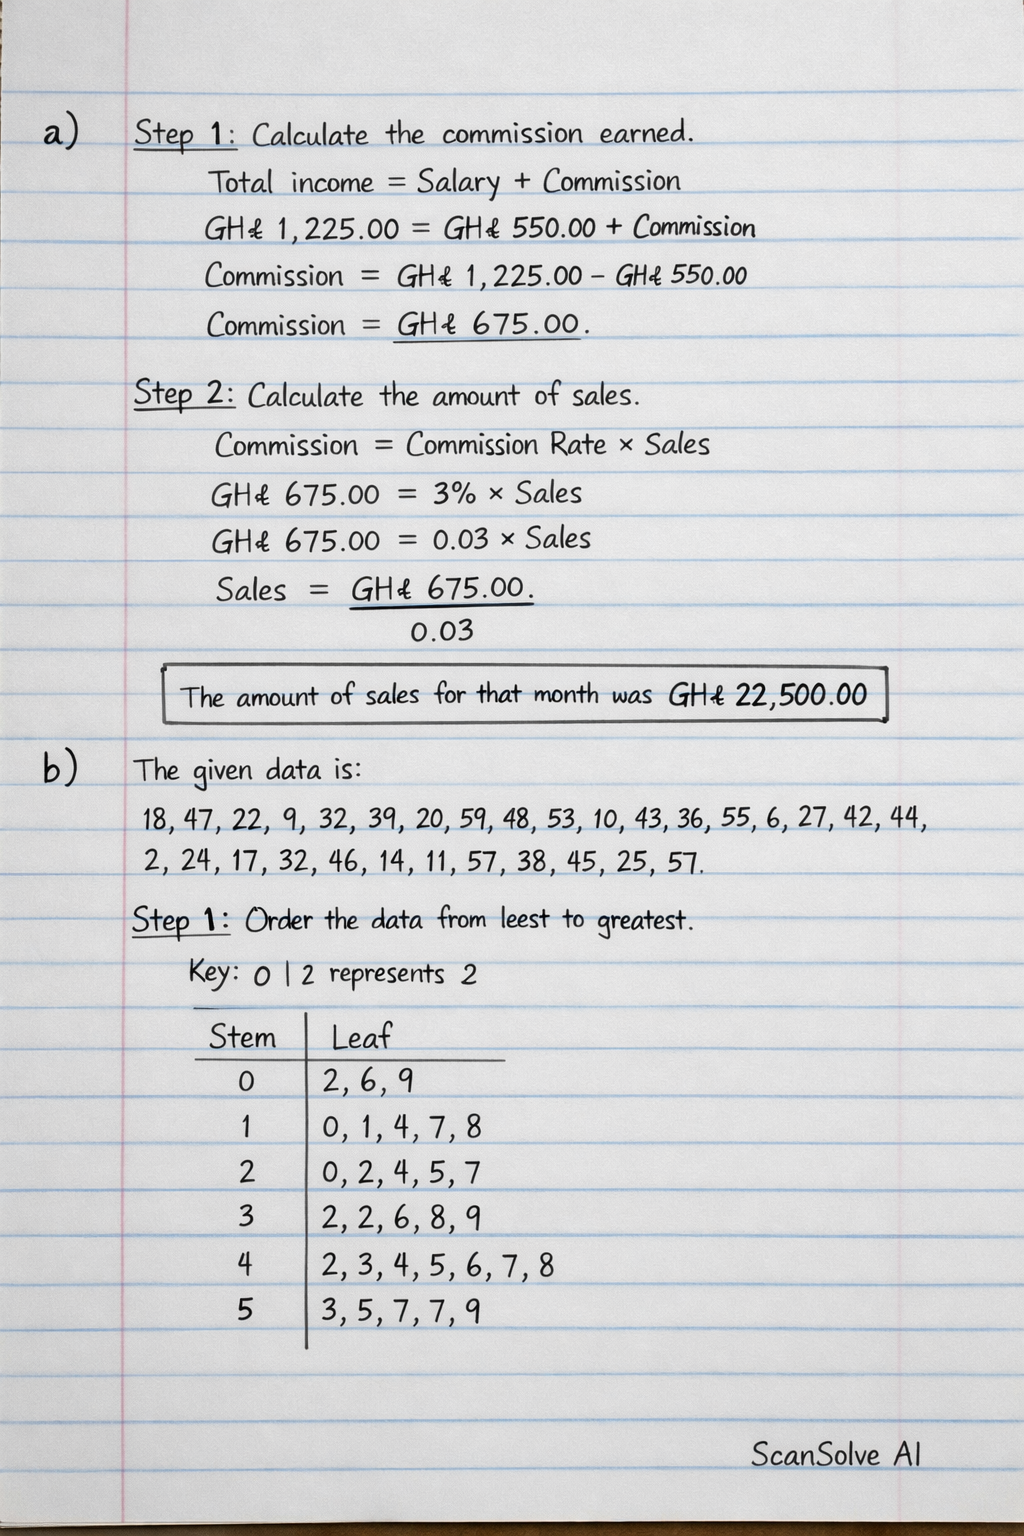
a) Step 1: Calculate the commission earned. Total income = Salary + Commission GH¢ 1,225.00 = GH¢ 550.00 + Commission Commission = GH¢ 1,225.00 - GH¢ 550.00 Commission = GH¢ 675.00 Step 2: Calculate the amount of sales. Commission = Commission Rate × Sales GH¢ 675.00 = 3% × Sales GH¢ 675.00 = 0.03 × Sales Sales = GH¢ 675.000.03 Sales = GH¢ 22,500.00 The amount of sales for that month was GH¢ 22,500.00. b) The given data is: 18, 47, 22, 9, 32, 39, 20, 59, 48, 53, 10, 43, 36, 55, 6, 27, 42, 44, 2, 24, 17, 32, 46, 14, 11, 57, 38, 45, 25, 57. Step 1: Order the data from least to greatest. 2, 6, 9, 10, 11, 14, 17, 18, 20, 22, 24, 25, 27, 32, 32, 36, 38, 39, 42, 43, 44, 45, 46, 47, 48, 53, 55, 57, 57, 59. i. Make a stem and leaf plot of the data. Key: 0|2 represents 2 c|l Stem & Leaf \\ 0 & 2, 6, 9 \\ 1 & 0, 1, 4, 7, 8 \\ 2 & 0, 2, 4, 5, 7 \\ 3 & 2, 2, 6, 8, 9 \\ 4 & 2, 3, 4, 5, 6, 7, 8 \\ 5 & 3, 5, 7, 7, 9 ii. Find the number of pupils who passed the test, if the pass mark was 45. Pupils passed if their mark is 45 or greater. From the ordered data: 45, 46, 47, 48, 53, 55, 57, 57, 59. There are 9 pupils who passed. The number of pupils who passed the test is 9. iii. Find the modal mark of the distribution. The mode is the number that appears most frequently in the data set. From the ordered data, 32 appears twice, and 57 appears twice. All other numbers appear once. The modal marks are 32 and 57. c) Step 1: Calculate the volume of the rectangular tank. Volume = length × width × height Volume = 3.5 m × 4 m × 5 m Volume = 70 m^3 Step 2: Calculate the amount of water left in the tank. Water left = Initial volume - Water used Water left = 70 m^3 - 38 m^3 Water left = 32 m^3 The amount of water left in the tank is 32 m^3. d) The relation given is 46t = d + 10t. Step 1: Rearrange the relation to express d in terms of t. d = 46t - 10t d = 36t a) Draw a table for the relation d = 36t for values of t in the range \1, 2, 3, 4, 5, 6\ seconds. |c|c| t (seconds) & d = 36t (metres) \\ 1 & 36 \\ 2 & 72 \\ 3 & 108 \\ 4 & 144 \\ 5 & 180 \\ 6 & 216 \\ The table is provided above. To draw the graph: • Draw a horizontal axis (t-axis) and a vertical axis (d-axis) intersecting at the origin (0,0). • On the t-axis, mark units from 0 to 6, with 2cm representing 1 unit. • On the d-axis, mark units from 0 to 220, with 2cm representing 20 units. b) On the same graph sheet, mark the t, second axis from 0 to 6 and the d distance axis from 0 to 220. This is part of the graph setup described in part (a). c) Plot on the same graph, the ordered pair (t, d) from the relation and join with a straight line. Plot the points from the table: (1, 36), (2, 72), (3, 108), (4, 144), (5, 180), (6, 216). Connect these points with a straight line. d) Using your graph; i. how long does it take to reach a height of 90metres? To find this using the graph, locate d = 90 on the d-axis, move horizontally to the line, then move vertically down to the t-axis to read the corresponding time. Algebraically: d = 36t 90 = 36t t = (90)/(36) t = (5)/(2) t = 2.5 seconds It takes 2.5 seconds to reach a height of 90 metres. ii. find the gradient of the line, 46t = d + 10t. The equation of the line is d = 36t. This is in the form y = mx + c, where m is the gradient. Here, m = 36 and c = 0. The gradient of the line is 36.