
We read your photo as:
A survey of 20 people was conducted on their favorite football team. The results were: Brazil (8 people), Germany (7 people), Italy (3 people), and France (2 people). Calculate the central angles for
Mathematics
ScanSolve AI Answer
Step-by-step solution
4 stepsHere's the solution to question III:
Answer part 1a) and 1b).
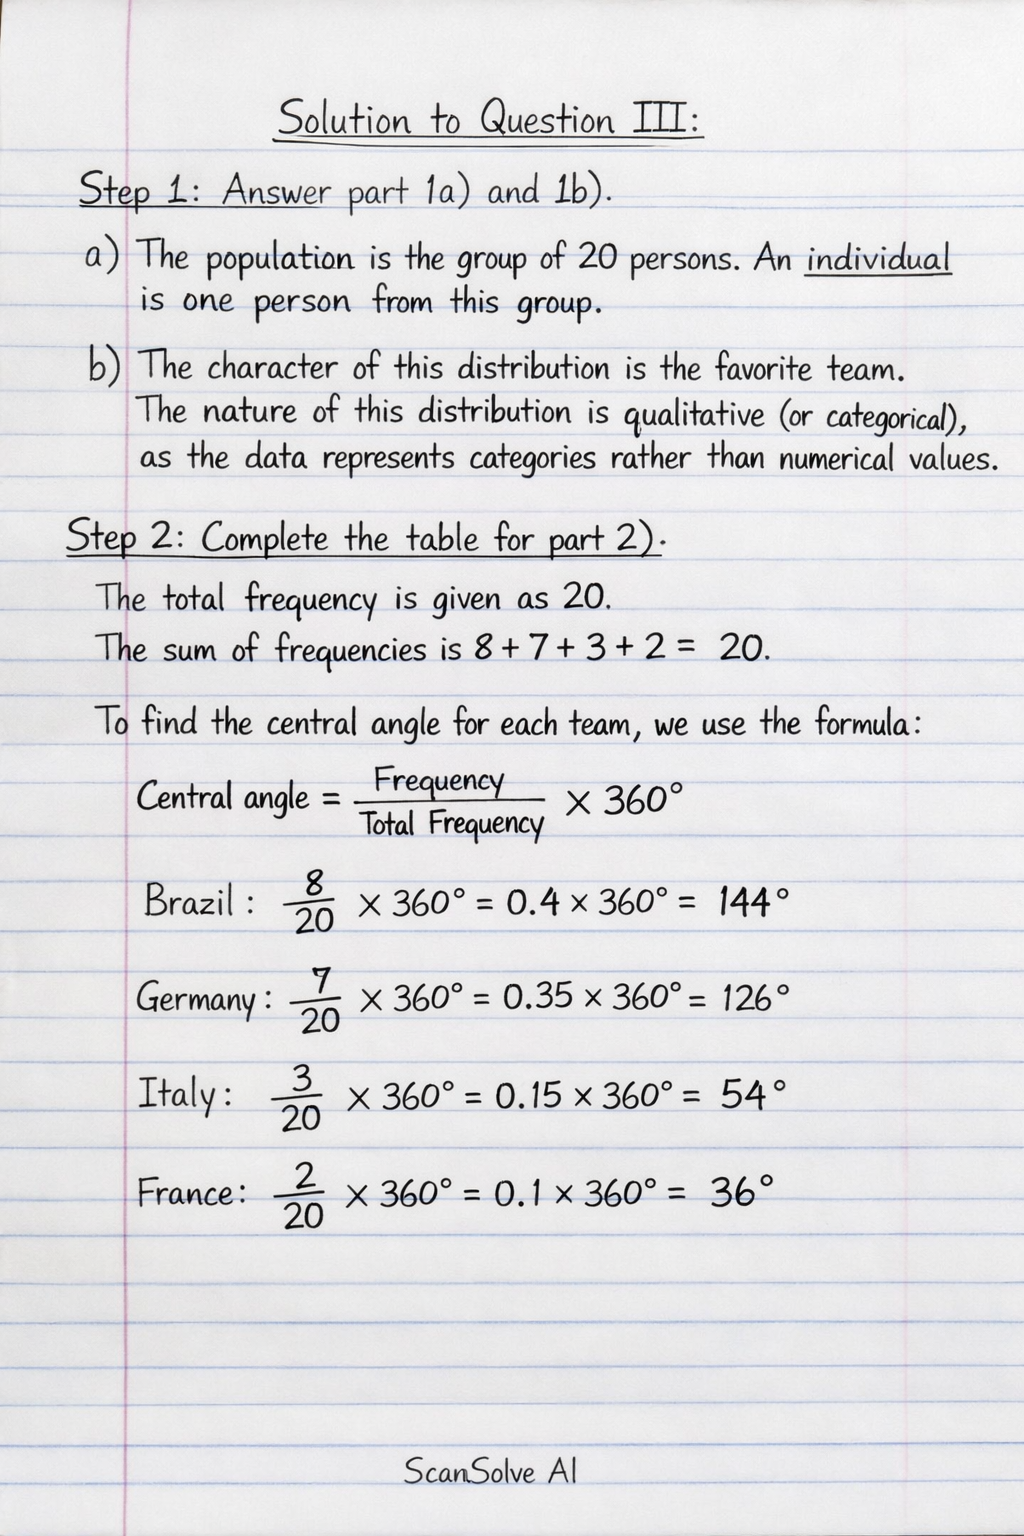
- a) The population is the group of 20 persons. An individual is one person from this group.
- b) The character of this distribution is the favorite team. The nature of this distribution is qualitative (or categorical), as the data represents categories rather than numerical values.
Complete the table for part 2).
The total frequency is given as 20. The sum of frequencies is .
To find the central angle for each team, we use the formula:- Brazil:
- Germany:
- Italy:
- France:
The completed table is:
Favorite team Brazil Germany Italy France Total Frequency 8 7 3 2 20 Central angle Find the percentage of persons who like Germany team for part 3).
The frequency for Germany is 7, and the total frequency is 20.
The percentage of persons who like the Germany team is .
Describe how to draw the bar graph of frequencies for part 4).
To draw a bar graph of frequencies:
- Draw a horizontal axis (x-axis) and label it "Favorite Team". Mark categories for Brazil, Germany, Italy, and France.
- Draw a vertical axis (y-axis) and label it "Frequency". Scale this axis from 0 up to at least 8 (the highest frequency).
- For each team, draw a vertical bar whose height corresponds to its frequency:
- Brazil: Bar height of 8 units.
- Germany: Bar height of 7 units.
- Italy: Bar height of 3 units.
- France: Bar height of 2 units.
- Ensure the bars are of equal width and are separated by small gaps.
Was this helpful?
Still stuck on this one?
Ask a follow-up, and the answer starts from this question.
Got a different question?Ask your own question
More Mathematics Questions
QCreate a pie chart to represent the number of learners who prefer different games: Football (18)…QRepresent the given data about students' favorite games and languages using pie charts. Calculate…QData. Do a survey in your class of favourite sports. Present the data in a table like that on page…QA) In a survey at airport, 55 travelers said that last year they had been to Spain, 53 to France and…QIn the figure below, line OP is parallel to line RS. Angle OPR is twice angle PRS. Find the size of…
Handwritten Step-by-Step Solution
Get this as a handwritten image on WhatsApp — like a tutor wrote it for you.
Try on WhatsApp