
We read your photo as:
Based on the "Fishing Trip Results" graph, answer the following: a) When were the most fish caught? b) When were the fewest fish caught? c) From 5 am to 6 am, did the number of fish caught increase or
ScanSolve AI Answer
Step-by-step solution
3 stepsHere are the answers to your questions based on the "Fishing Trip Results" graph:
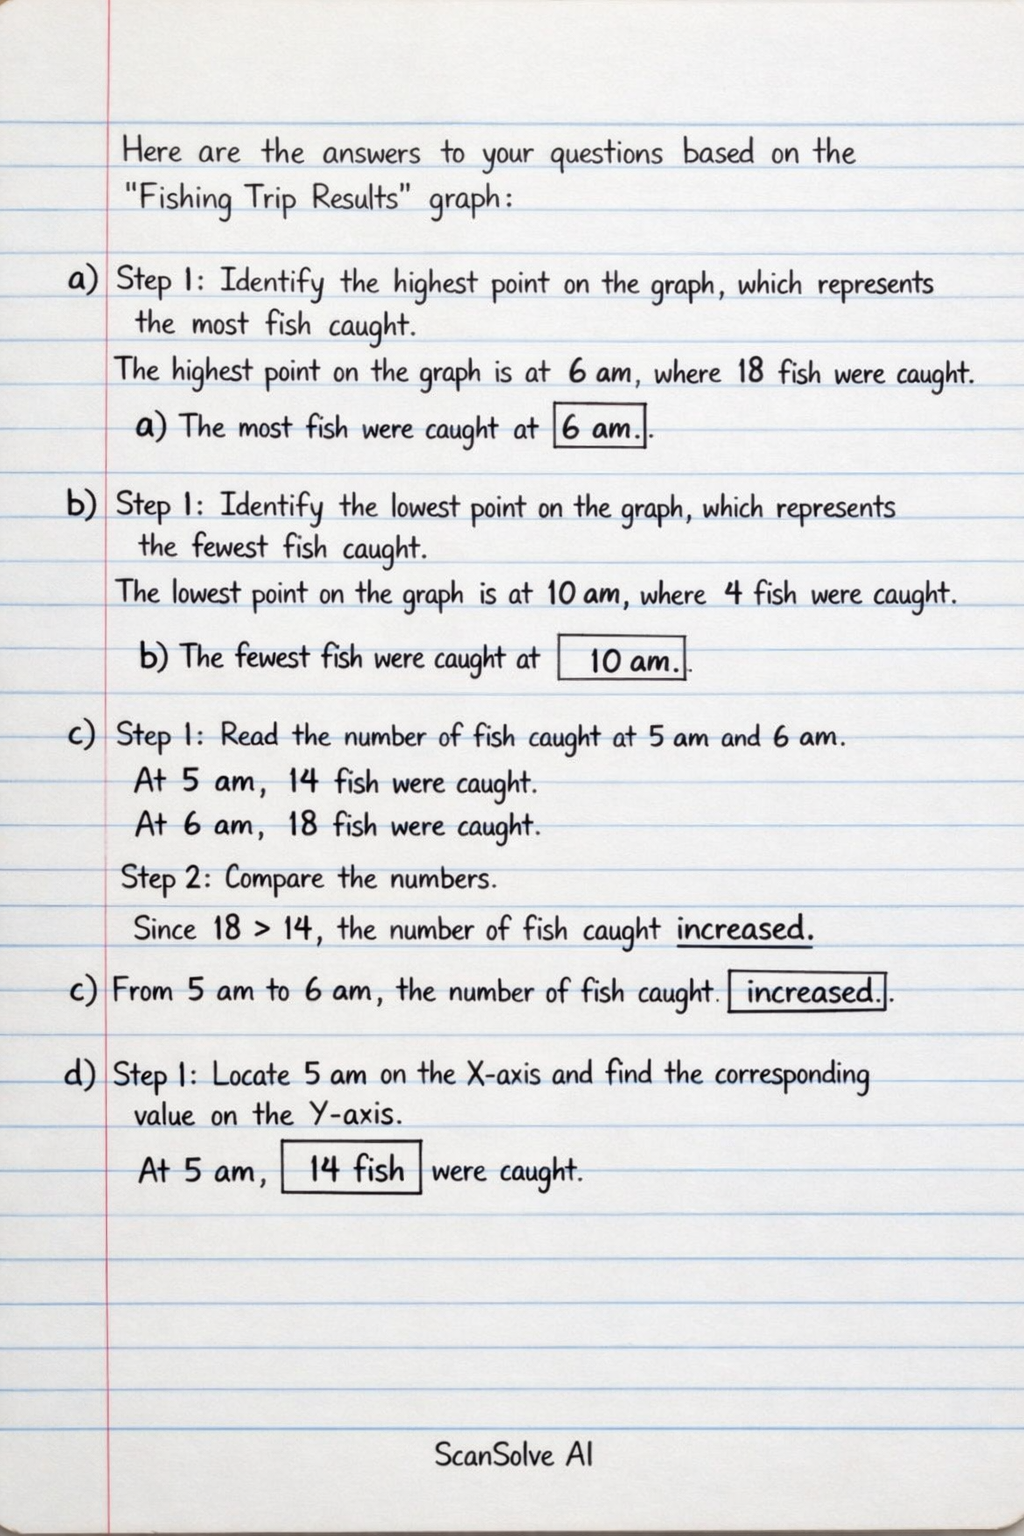
a) Step 1: Identify the highest point on the graph, which represents the most fish caught.
The highest point on the graph is at , where 18 fish were caught.
a) The most fish were caught at .
b) Step 1: Identify the lowest point on the graph, which represents the fewest fish caught.
The lowest point on the graph is at , where 4 fish were caught.
b) The fewest fish were caught at .
c) Step 1: Read the number of fish caught at and .
At , 14 fish were caught.
At , 18 fish were caught.
Compare the numbers.
Since , the number of fish caught increased.
c) From to , the number of fish caught .
d) Step 1: Locate on the X-axis and find the corresponding value on the Y-axis.
At , were caught.e) Step 1: Locate on the X-axis and find the corresponding value on the Y-axis.
At , were caught.f) Step 1: Read the number of fish caught at and .
At , 6 fish were caught.
At , 4 fish were caught.Compare the numbers.
Since , more fish were caught at .
f) More fish were caught at .
g) Step 1: List the number of fish caught at each time point.
- fish
- fish
- fish
- fish
- fish
- fish
- fish
Sum the number of fish caught.
g) The total number of fish caught is .
Still stuck on this one?
Ask a follow-up, and the answer starts from this question.
More Mathematics Questions
Handwritten Step-by-Step Solution
Get this as a handwritten image on WhatsApp — like a tutor wrote it for you.
Try on WhatsApp