
We read your photo as:
Use the provided graph to answer the following questions about the elephant population on a game farm: a) Did the elephant population increase or decrease between 1970 and 1980? b) Between which years
ScanSolve AI Answer
Step-by-step solution
11 stepsHere's the solution to Question 1:
Part a· 2 steps
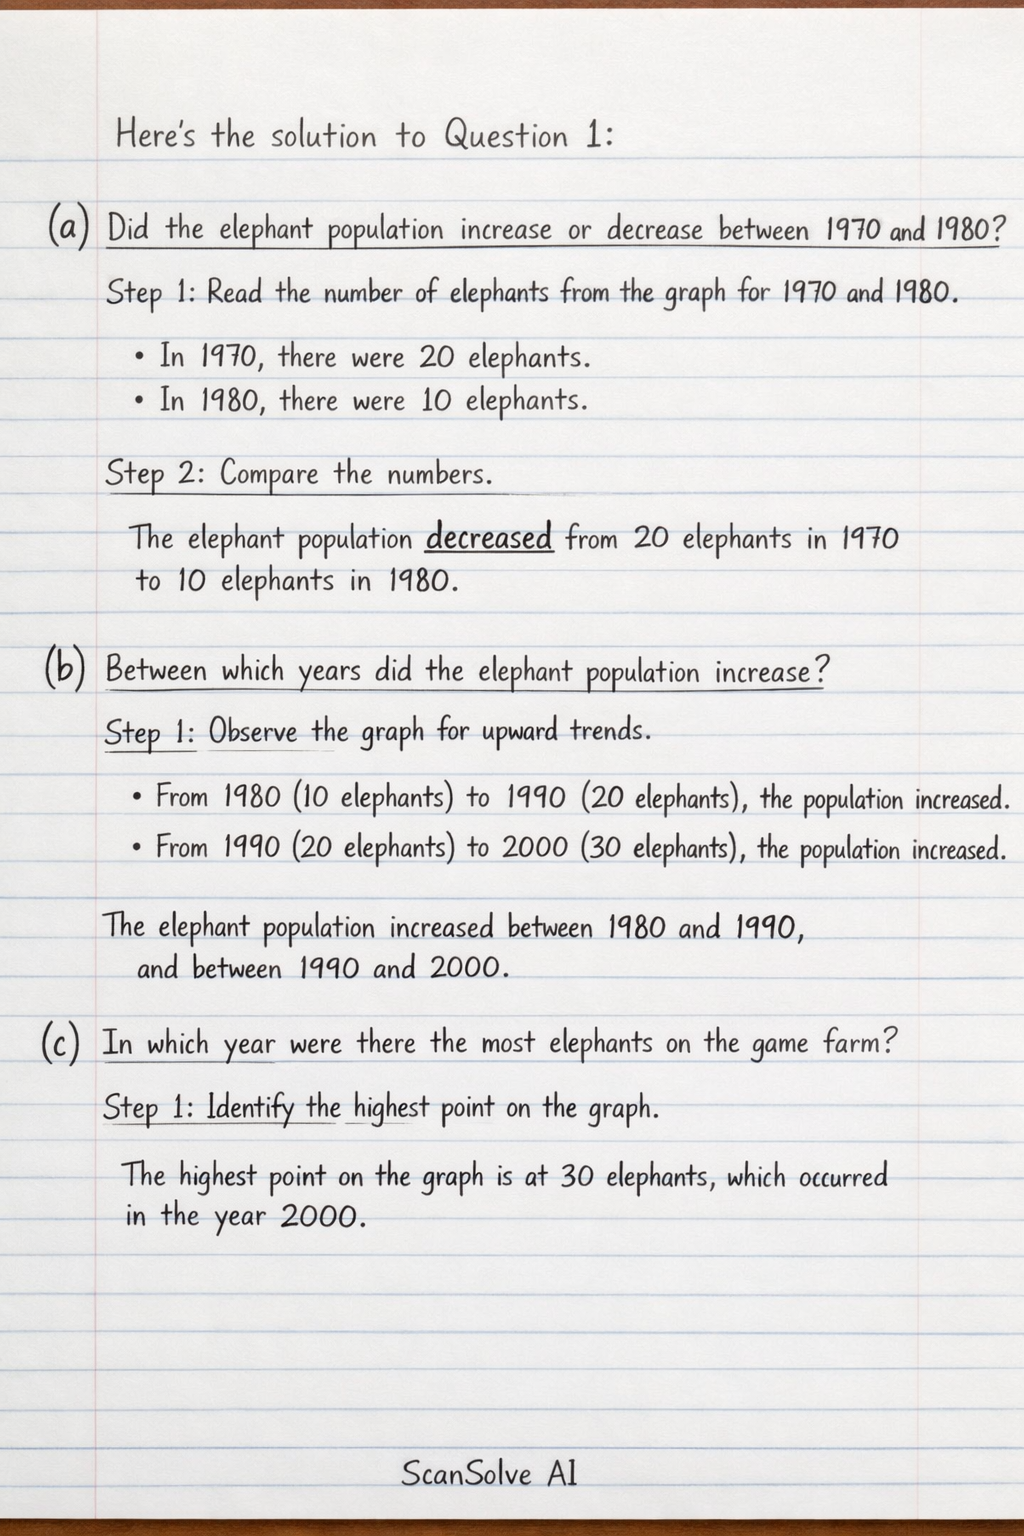
Did the elephant population increase or decrease between 1970 and 1980?
Read the number of elephants from the graph for 1970 and 1980.
- In 1970, there were 20 elephants.
- In 1980, there were 10 elephants.
Compare the numbers.
The elephant population decreased from 20 elephants in 1970 to 10 elephants in 1980.
Part b· 1 step
Between which years did the elephant population increase?
Observe the graph for upward trends.
- From 1980 (10 elephants) to 1990 (20 elephants), the population increased.
- From 1990 (20 elephants) to 2000 (30 elephants), the population increased. The elephant population increased between 1980 and 1990, and between 1990 and 2000.
Part c· 1 step
In which year were there the most elephants on the game farm?
Identify the highest point on the graph.
The highest point on the graph is at 30 elephants, which occurred in the year 2000.
Part d· 3 steps
Approximately how many elephants do you think were on the reserve in 1995?
Locate 1995 on the x-axis, which is halfway between 1990 and 2000.
Read the number of elephants for 1990 and 2000 from the graph.
- In 1990, there were 20 elephants.
- In 2000, there were 30 elephants.
Estimate the value halfway between 20 and 30.
The approximate number of elephants in 1995 was 25.
Part e· 2 steps
The following table shows the number of elephants at a different game reserve. Plot this information on the same set of axes as above.
Plot the following points on the graph
- (1960, 30)
- (1970, 25)
- (1980, 20)
- (1990, 15)
- (2000, 20)
- (2010, 35)
Connect these points with straight lines to represent the population trend of the second game reserve.
Part f· 2 steps
Would you say that the second game reserve had more elephants than the first game reserve between 1960 and 2010? Explain your answer.
Compare the elephant numbers for both reserves over the given period.
- First Game Reserve (from graph): 1960 (25), 1970 (20), 1980 (10), 1990 (20), 2000 (30), 2010 (20).
- Second Game Reserve (from table): 1960 (30), 1970 (25), 1980 (20), 1990 (15), 2000 (20), 2010 (35).
Calculate the total number of elephants for each reserve over the period.
- First Reserve Total: elephants.
- Second Reserve Total: elephants. Yes, the second game reserve generally had more elephants than the first game reserve between 1960 and 2010. The total number of elephants recorded in the second reserve (145) is higher than in the first reserve (125) over the same period, and its population also reached a higher peak (35 in 2010) compared to the first reserve's peak (30 in 2000).
Still stuck on this one?
Ask a follow-up, and the answer starts from this question.
More Mathematics Questions
Handwritten Step-by-Step Solution
Get this as a handwritten image on WhatsApp — like a tutor wrote it for you.
Try on WhatsApp