
We read your photo as:
Complete Table 2 on the relation y = -2x + 3, for the values of x from -3 to +5. (b) Use a scale of 2 cm to 1 unit on the x-axis and 2 cm to 2 units on the y-axis, draw the graph of the equation y = -2x + 3. (c) From the graph, determine the value of: (i) the slope; (ii) x when y = -5.
ScanSolve AI Answer
Answers
2 partsStep-by-step solution
5 stepsPart a· 2 steps
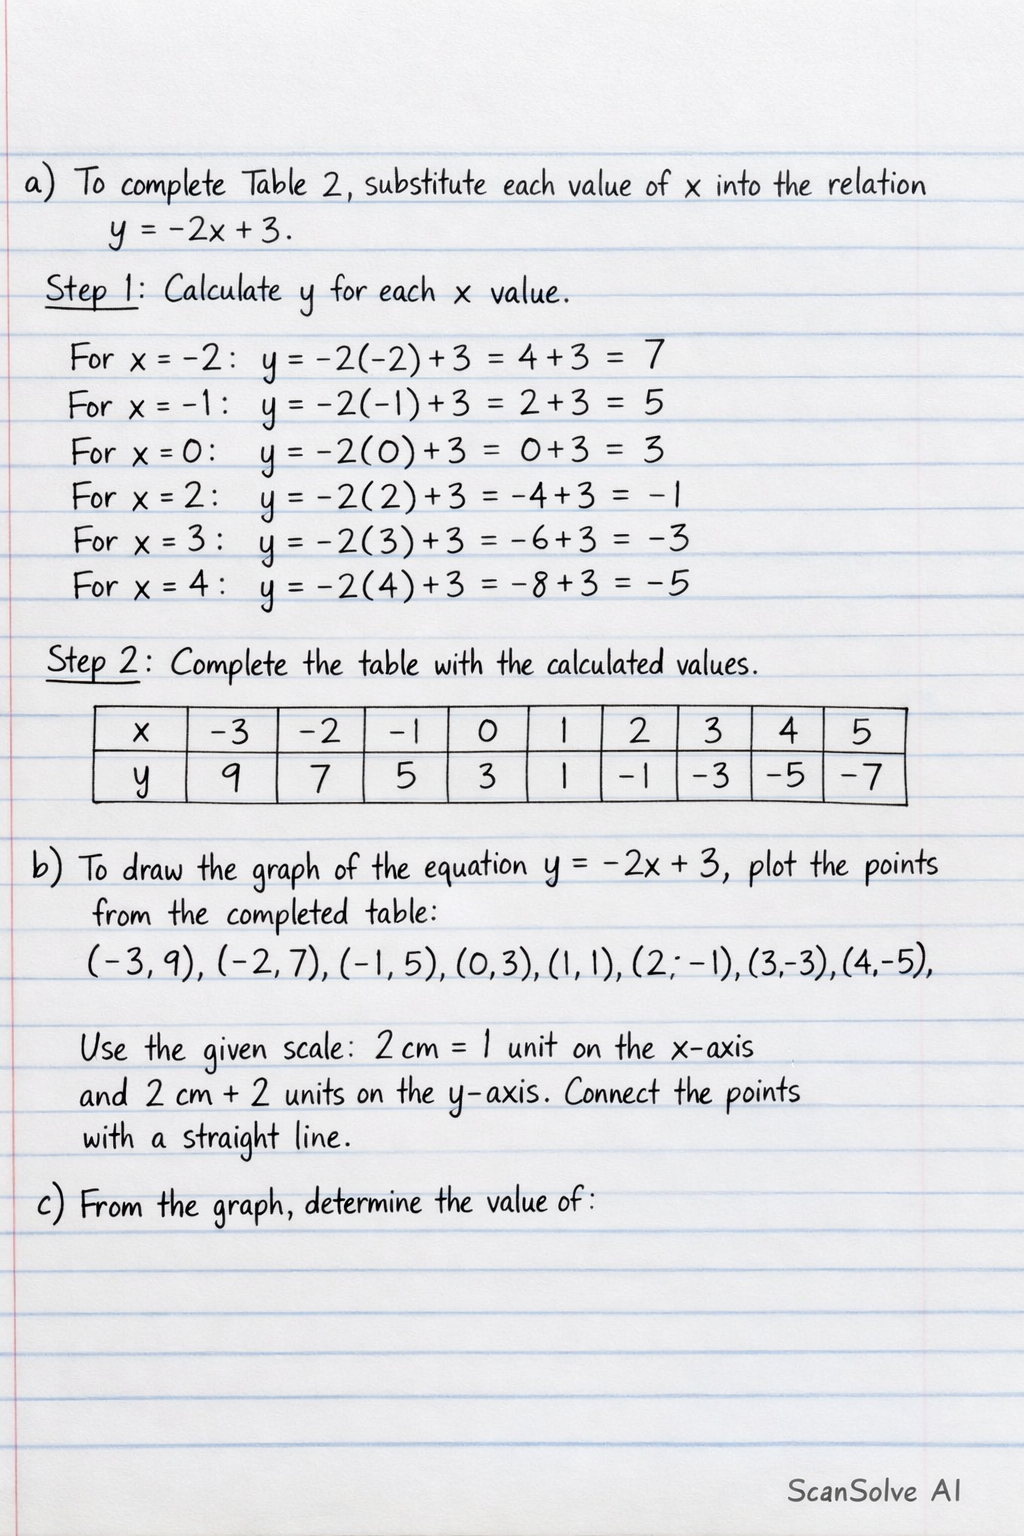
To complete Table 2, substitute each value of into the relation .
Calculate for each value.
For :
For :
For :
For :
For :
For :Complete the table with the calculated values.
Part b
To draw the graph of the equation , plot the points from the completed table: .
Use the given scale: to on the -axis and to on the -axis. Connect the points with a straight line.
(As an AI, I cannot draw the graph for you, but these are the points you would plot.)
Part c(i)-2
the slope;
From the graph, determine the value of
The equation is , which is in the form , where is the slope.
Identify the slope from the equation.
The coefficient of is the slope.
The slope is .
Part c(ii)4
when .
Substitute into the equation .
Solve for .
Try one yourself
A new problem that tests the same skill.
Still stuck on this one?
Ask a follow-up, and the answer starts from this question.
More Mathematics Questions
Handwritten Step-by-Step Solution
Get this as a handwritten image on WhatsApp — like a tutor wrote it for you.
Try on WhatsApp