
We read your photo as:
Complete the table and draw the graphs for y = 2 extcos x and y = 3 extsin x for x from 0^ exto to 360^ exto in intervals of 30^ exto.
ScanSolve AI Answer
Step-by-step solution
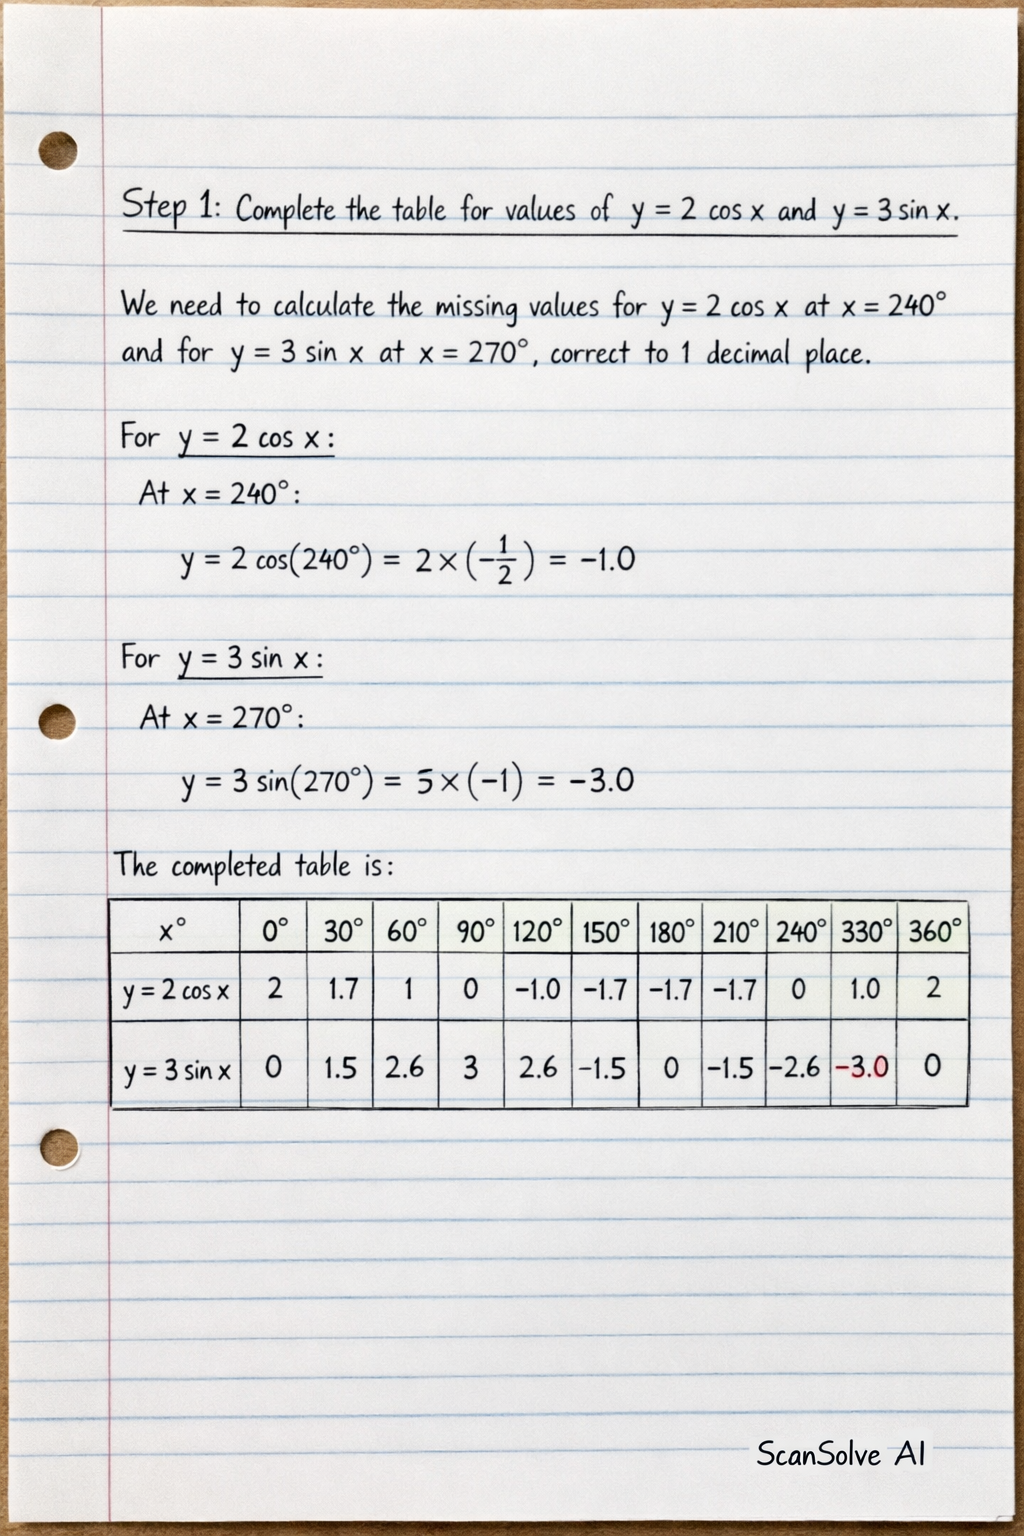
2 stepsStep 1: Complete the table for values of and .
We need to calculate the missing values for at and for at , correct to 1 decimal place.
For :
At :
For :
At :
The completed table is:
| 2 | 1.7 | 1 | 0 | 0 | 1.0 | 1.7 | 2 | ||||||
| 0 | 1.5 | 2.6 | 3 | 2.6 | 1.5 | 0 | 0 |
Step 2: Draw the graph of and .
Part a
Set up the axes on the provided grid. The x-axis should represent angles from to . A suitable scale would be for .
Part b
The y-axis should represent values from approximately to 3.0. A suitable scale would be for 1 unit.
Part c
Plot the points from the completed table for and draw a smooth curve through them. Label this curve .
Part d· 2 steps
Plot the points from the completed table for and draw a smooth curve through them. Label this curve .
Use the graph to find the values of when .
The equation can be rewritten as .
This means we need to find the x-coordinates of the intersection points of the two graphs, and .
From the graph, locate the points where the two curves intersect.
The intersection points occur at approximately:
andUse the graph to find the values of when .
This asks for the y-coordinates of the intersection points found in Step 3.
At , read the corresponding y-value from either graph.
At , read the corresponding y-value from either graph.
The values of are approximately and .
Still stuck on this one?
Ask a follow-up, and the answer starts from this question.
More Mathematics Questions
Handwritten Step-by-Step Solution
Get this as a handwritten image on WhatsApp — like a tutor wrote it for you.
Try on WhatsApp