
We read your photo as:
Complete the table showing the male and female populations and their percentages for different age groups, given the total population and male population for each group.
Mathematics
ScanSolve AI Answer
This answer stops before the end.
It was cut off when it was first written. Ask ScanSolve this question again for the full working.
Here is the completed table based on the provided data.
Step 1: Understand the relationships.
Let be the Total population, be the Number of Male, and be the Number of Female.
The relationships are:
Step 2: Calculate the missing values for each age group using the formulas above. Percentages are rounded to two decimal places.
Here is the completed table:
\begin{tabular}{|Was this helpful?
Still stuck on this one?
Ask a follow-up, and the answer starts from this question.
Got a different question?Ask your own question
More Mathematics Questions
QComplete the following table regarding population demographics, calculating missing values for total…QHow do I draw a population pyramid using bar graphs, given age and sex distribution data?QAnalyze the provided graph showing patient data and answer the following questions about the number…QHow do I construct an age-sex population pyramid from given data?QCalculate the number of children in a city with a total population of 9,28,078, where there are…
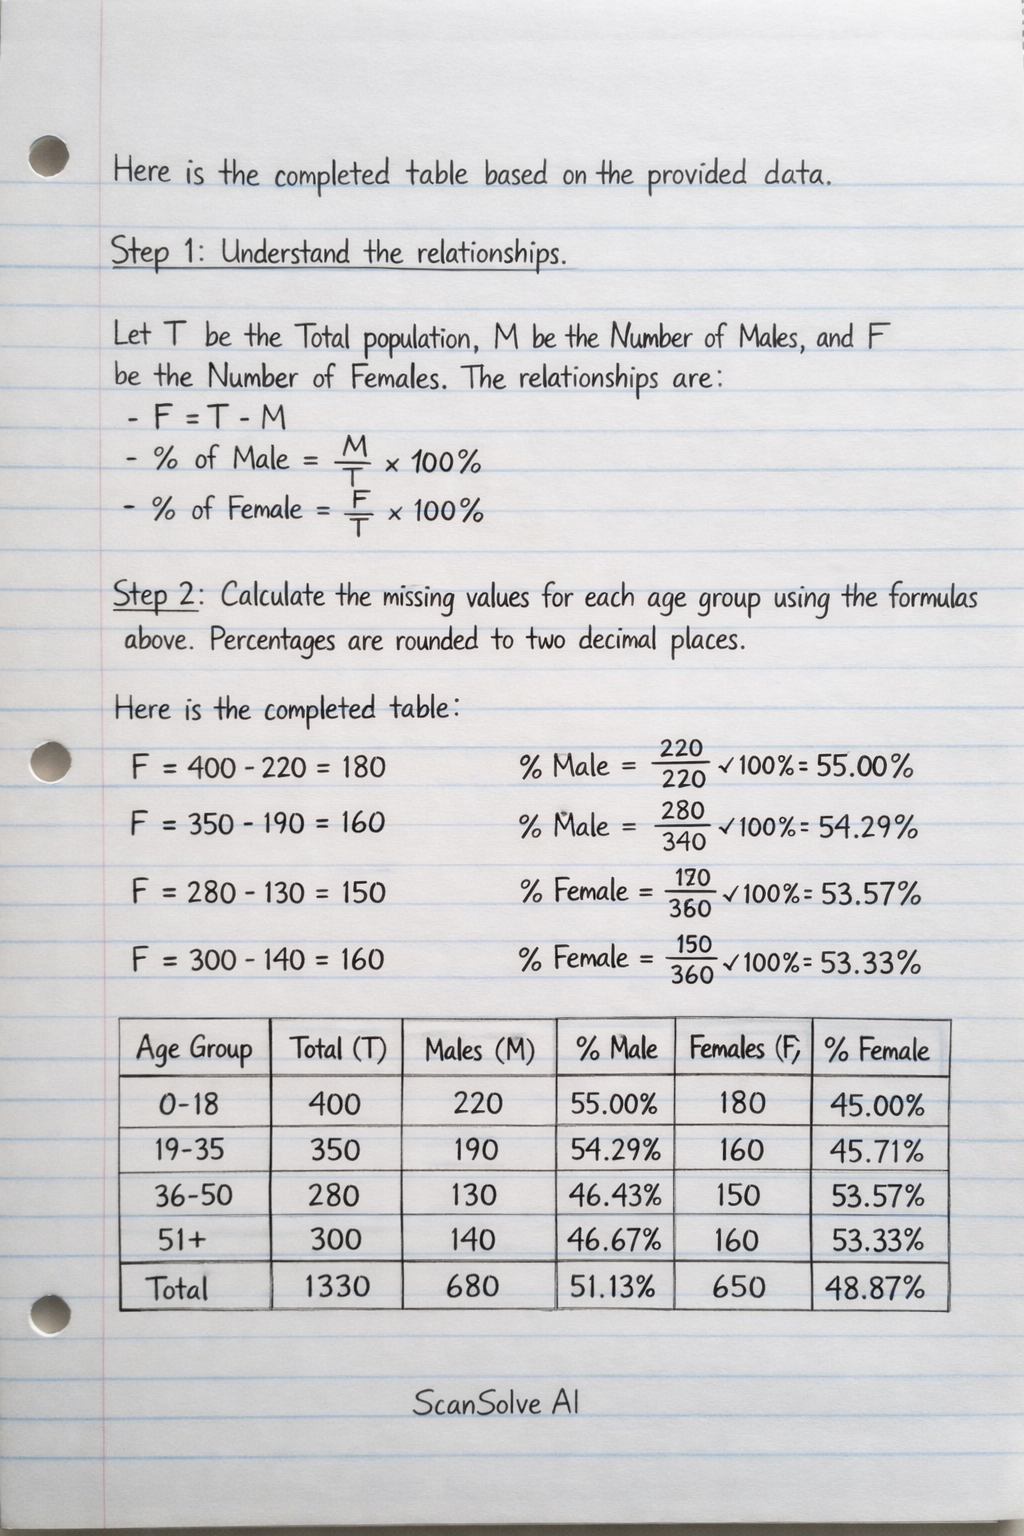
Handwritten Step-by-Step Solution
Get this as a handwritten image on WhatsApp — like a tutor wrote it for you.
Try on WhatsApp