
We read your photo as:
How do I construct an age-sex population pyramid from given data?
ScanSolve AI Answer
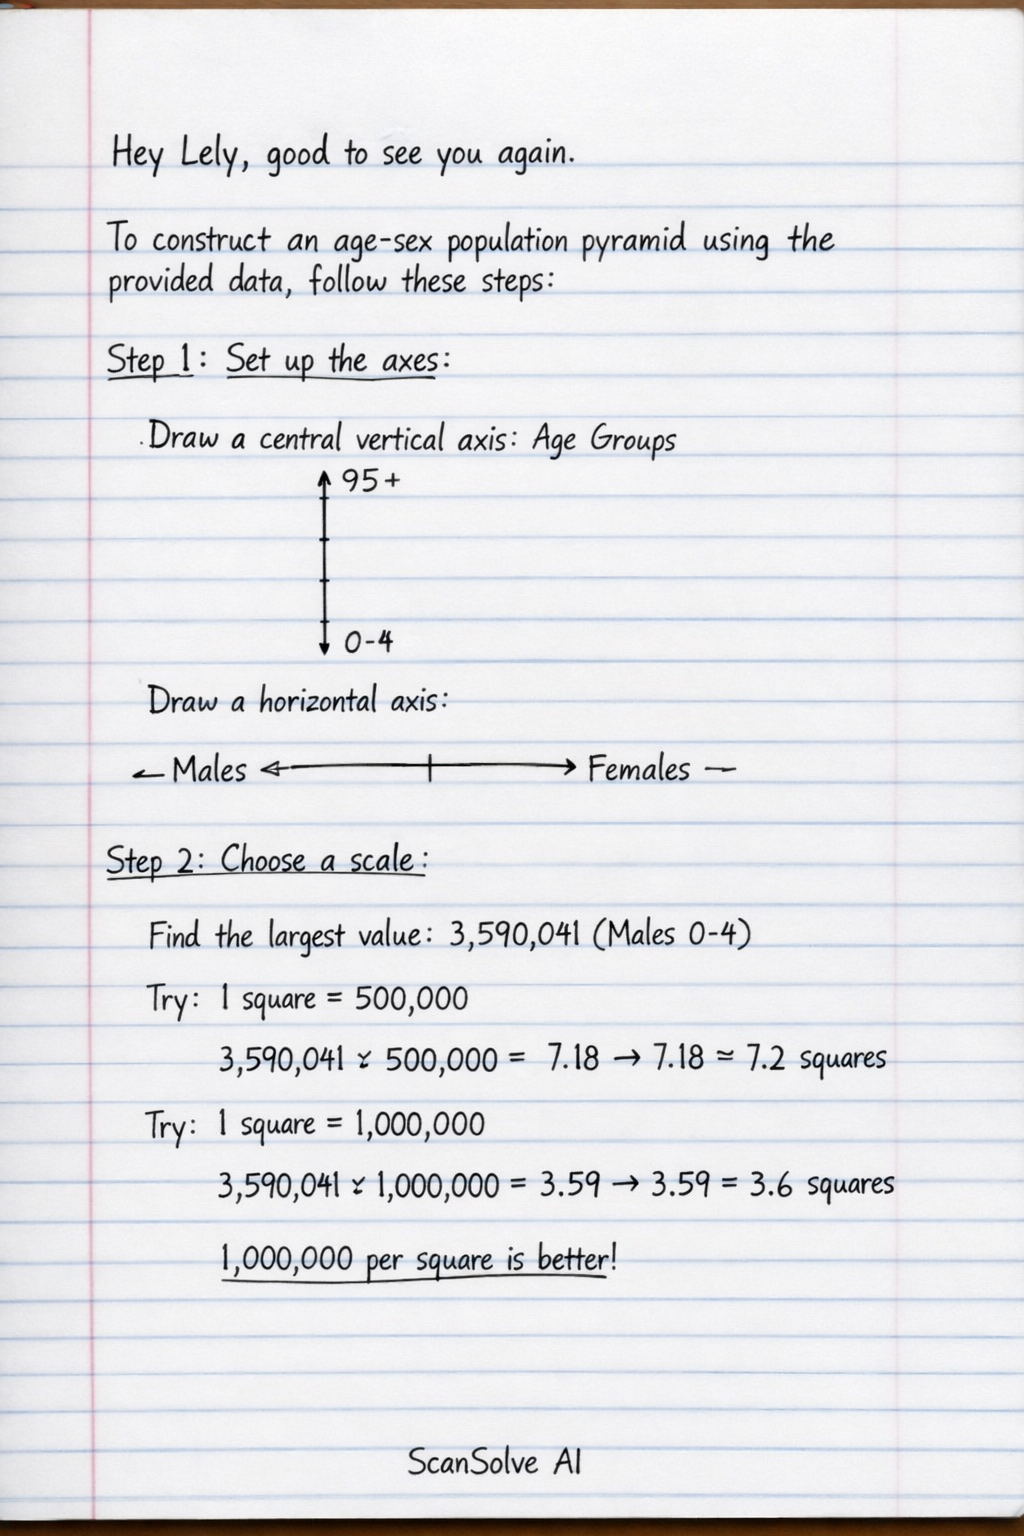
To construct an age-sex population pyramid using the provided data, follow these steps:
-
Step 1: Set up the axes. Draw a central vertical axis on your graph paper. This axis will represent the Age groups, with the youngest age group (0-4) at the bottom and the oldest (95 and above) at the top. Draw a horizontal axis extending from the center to both the left and right. This axis will represent the Number of males (on the left) and Number of females (on the right).
-
Step 2: Choose a scale. Examine the "Number of females" and "Number of males" columns to find the largest population value (which is 3,590,041 for males aged 0-4). Select an appropriate scale for your horizontal axis so that all population numbers can be represented clearly. For example, each grid line could represent 500,000 or 1,000,000 people.
-
Step 3: Plot the data for each age group. For each age group listed in the table:
- Draw a horizontal bar to the left of the central vertical axis, with its length corresponding to the "Number of males" for that age group, according to your chosen scale.
- Draw a horizontal bar to the right of the central vertical axis, with its length corresponding to the "Number of females" for that age group, according to your chosen scale. Ensure the bars for each age group are centered on their respective age interval on the vertical axis.
-
Step 4: Add labels and title. Label the vertical axis "Age Group" and the horizontal axis "Population (in millions/thousands)". Clearly indicate which side represents males and which represents females. Give your pyramid a clear title, such as "Age-Sex Population Pyramid of Kenya".
The resulting graph will show the distribution of males and females across different age groups, forming the shape of a population pyramid.
Still stuck on this one?
Ask a follow-up, and the answer starts from this question.
More Geography Questions
Handwritten Step-by-Step Solution
Get this as a handwritten image on WhatsApp — like a tutor wrote it for you.
Try on WhatsApp