
We read your photo as:
Consider a business that sells burgers. The selling price of each burger is R30.00. The fixed costs are R120.00 and the cost to make one burger is R10.00. A) Determine the formula for Income and Expen
Mathematics
ScanSolve AI Answer
Step-by-step solution
6 stepshere are the solutions to the questions:
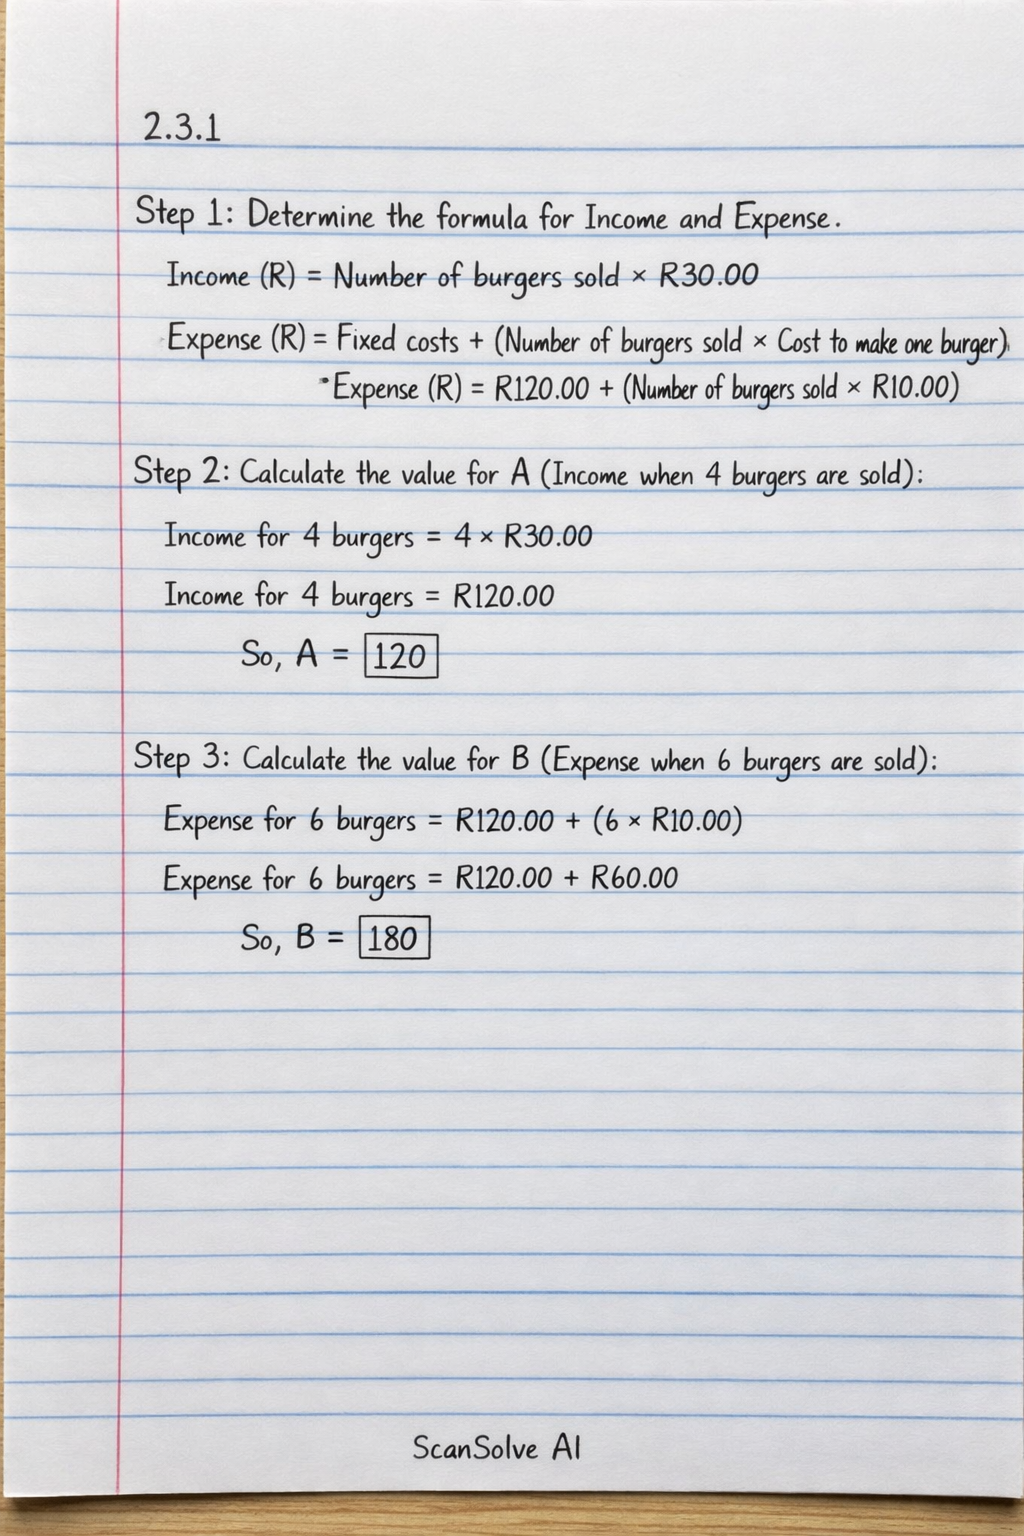
2.3.1
Determine the formula for Income and Expense.
- Income (R) = Number of burgers sold R
- Expense (R) = Fixed costs + (Number of burgers sold Cost to make one burger) Expense (R) = R + (Number of burgers sold R)
Calculate the value for A (Income when 4 burgers are sold).
So, A = .
Calculate the value for B (Expense when 6 burgers are sold).
So, B = .
The completed table is:
Number of burgers sold 0 2 4 6 8 10 Income (R) 0 60 120 180 240 300 Expense (R) 120 140 160 180 200 220 2.3.2
Identify the coordinates for plotting the Income and Expense graphs.
- Income (Number of burgers, Income in R): (0, 0), (2, 60), (4, 120), (6, 180), (8, 240), (10, 300)
- Expense (Number of burgers, Expense in R): (0, 120), (2, 140), (4, 160), (6, 180), (8, 200), (10, 220)
Draw the graphs on a set of axes.
Plot the income points and draw a line through them.
Plot the expense points and draw a line through them.
(Note: As an AI, I cannot draw the graph for you, but you can plot these points on graph paper.)Determine the break-even point from the graph.
The break-even point is where the Income graph and the Expense graph intersect. At this point, Income equals Expense.
From the table in 2.3.1, when 6 burgers are sold, both Income and Expense are R180.
Therefore, the break-even point is .
Was this helpful?
Still stuck on this one?
Ask a follow-up, and the answer starts from this question.
Got a different question?Ask your own question
More Mathematics Questions
QUse the information and Table 1 above to answer the questions that follow. 15.1.1 Differentiate…QAssume the following additional information for question 3 only: (i) Total annual fixed costs will…QCalculate Net Sales and Cost of Sales given the following information: Sales = R1,992,800; Sales…QA) Determine the table of P = 10(x) + 300 20 b) Write down an equation that can be used to calculate…QSolve the following problems related to profit and loss: 1. If the cost price is Gh¢12.50 and the…
Handwritten Step-by-Step Solution
Get this as a handwritten image on WhatsApp — like a tutor wrote it for you.
Try on WhatsApp