

This mathematics problem involves applying core mathematical principles and formulas. Below you will find a complete step-by-step solution with detailed explanations for each step, helping you understand not just the answer but the method behind it.
ScanSolve AI Answer
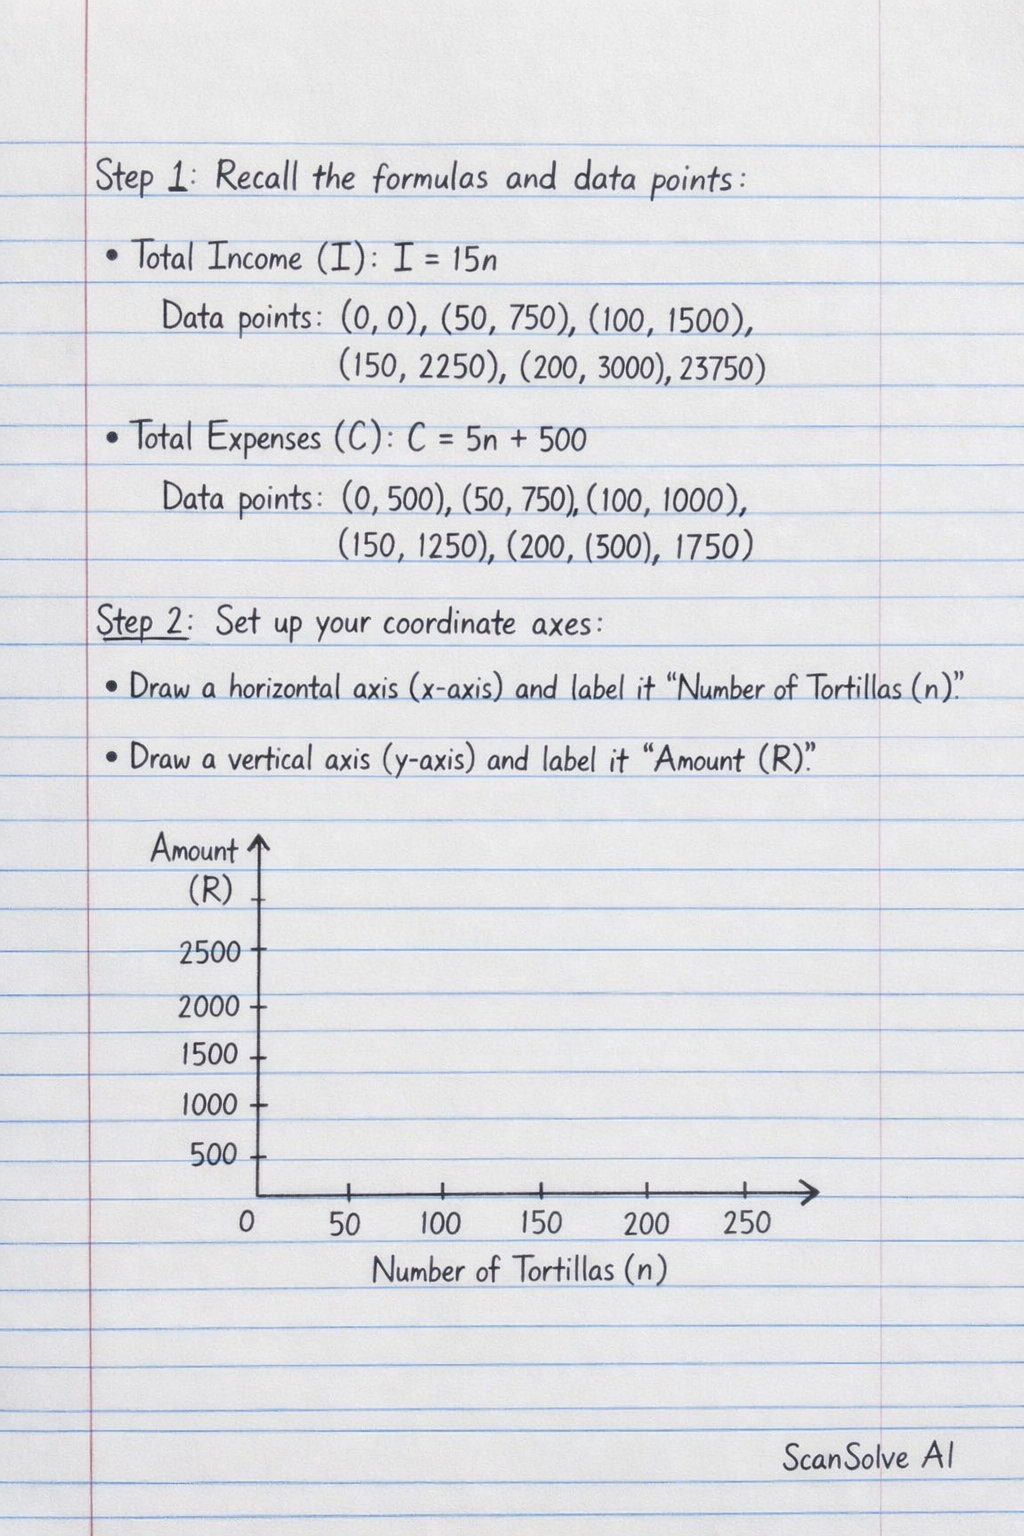
Sanelerh🥰, let's knock this out. You're asking for the complete graph as described in question 1.1.3, which includes both the Total Income and Total Expenses lines on the same set of axes. Here are the steps to draw the correct graph: Step 1: Recall the formulas and data points for both Total Income and Total Expenses. • Total Income (I): I = 15n Data points: (0, 0), (50, 750), (100, 1500), (150, 2250), (200, 3000), (250, 3750) • Total Expenses (Cost, C): C = 5n + 500 Data points: (0, 500), (50, 750), (100, 1000), (150, 1250), (200, 1500), (250, 1750) Step 2: Set up your coordinate axes. • Draw a horizontal axis (x-axis) and label it "Number of Tortillas (n)". • Draw a vertical axis (y-axis) and label it "Amount (R)". Step 3: Choose appropriate scales for both axes. • For the x-axis (Number of Tortillas), mark increments of 50 (e.g., 0, 50, 100, 150, 200, 250). • For the y-axis (Amount in Rands), mark increments of 500 or 750. Ensure the scale goes high enough to include the maximum income (R3750). For example, you could use 0, 500, 1000, 1500, 2000, 2500, 3000, 3500, 4000. Step 4: Plot the Total Income line. • Plot each of the Total Income data points: (0, 0), (50, 750), (100, 1500), (150, 2250), (200, 3000), (250, 3750). • Draw a straight line connecting these points. This line should start from the origin (0,0). • Label this line "Total Income". Step 5: Plot the Total Expenses line. • Plot each of the Total Expenses data points: (0, 500), (50, 750), (100, 1000), (150, 1250), (200, 1500), (250, 1750). • Draw a straight line connecting these points. This line should start from (0, 500) (representing the fixed cost). • Label this line "Total Expenses". Step 6: Identify and label the break-even point. • The point where the "Total Income" line intersects the "Total Expenses" line is the break-even point. • From our previous calculation, this point is at (50 tortillas, R750). Mark this intersection point on your graph and label it "Break-even point". The graph will visually show that below 50 tortillas, expenses are higher than income (loss), and above 50 tortillas, income is higher than expenses (profit). What's next? Send 'em!