
We read your photo as:
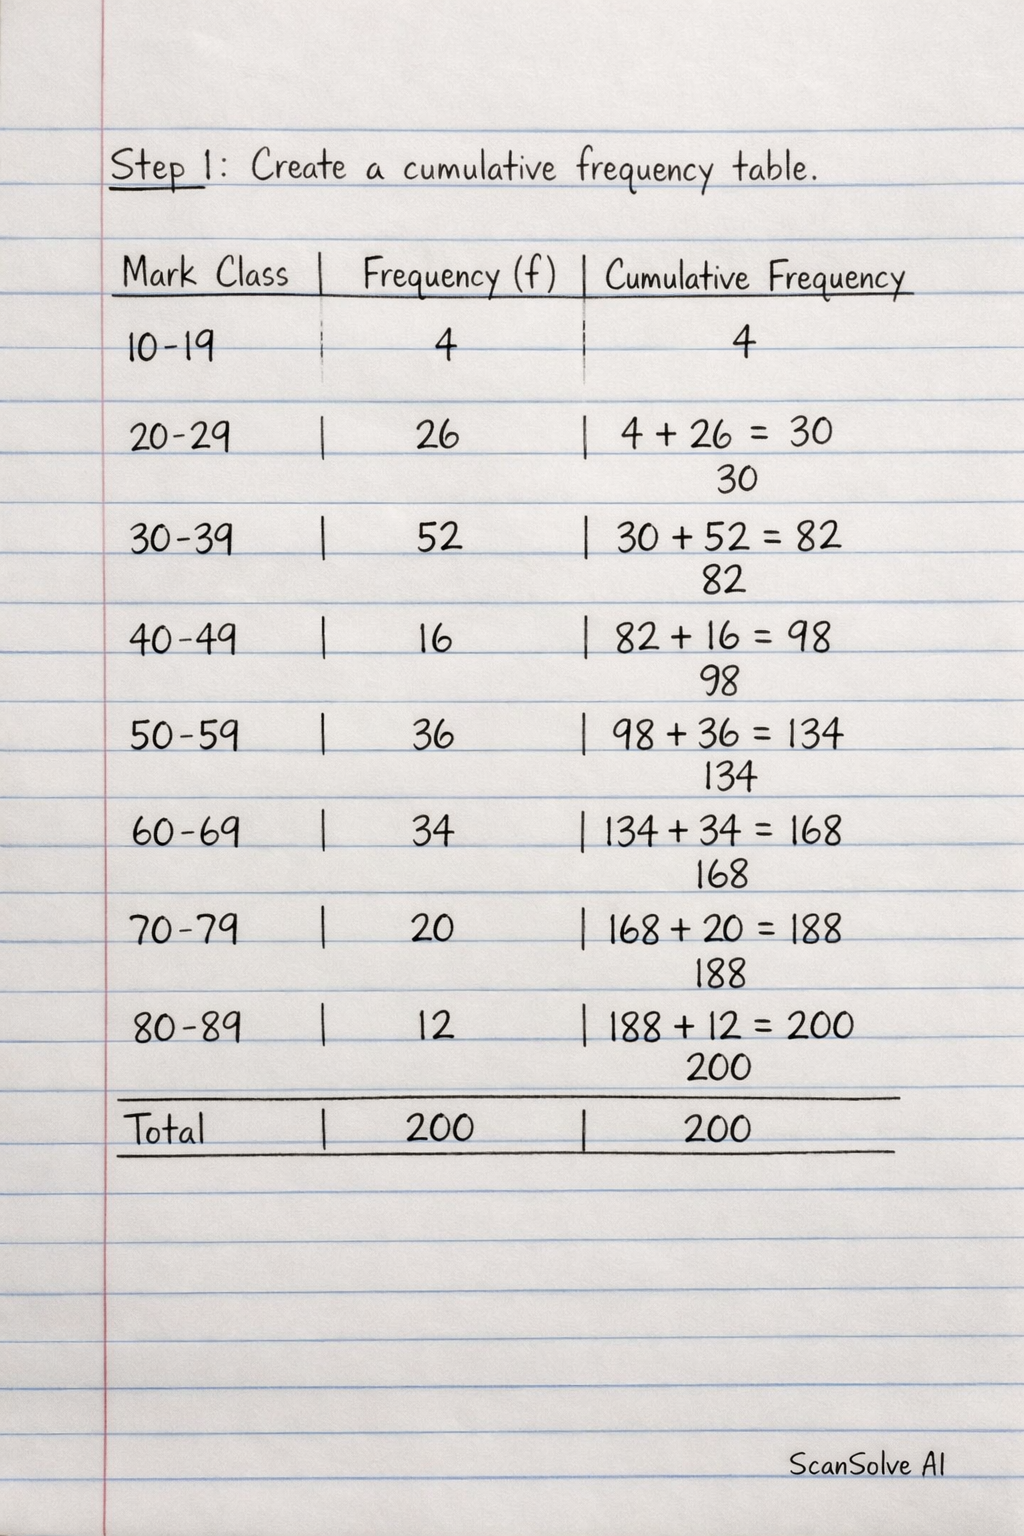
Construct a cumulative frequency table for the given frequency distribution of marks.
Mathematics
ScanSolve AI Answer
This answer stops before the end.
It was cut off when it was first written. Ask ScanSolve this question again for the full working.
Step 1: Create a cumulative frequency table.
The given frequency distribution is:
\begin{array}{|c|c|}
\hline
Mark Class & Frequency (f) \\
\hline
10-19 & 4 \\
20-29 & 26 \\
30-39 & 52 \\
40-49 & 16 \\
50-59 & 36 \\
60-69 & 34 \\
70-79 & 20 \\
80-89 & 12 \\
\hline
Total & 200 \\
\hline
\end{array
Was this helpful?
Still stuck on this one?
Ask a follow-up, and the answer starts from this question.
Got a different question?Ask your own question
More Mathematics Questions
QConstruct a cumulative frequency table and a cumulative frequency polygon from the given frequency…QCalculate the mean and cumulative frequency for the given marks using a frequency table.QConstruct a cumulative frequency table from the given frequency distribution.QConstruct a cumulative frequency table for the distribution.QComplete the table for marks and draw a cumulative frequency curve (ogive).
Browse by topic:Statistics
Handwritten Step-by-Step Solution
Get this as a handwritten image on WhatsApp — like a tutor wrote it for you.
Try on WhatsApp