
We read your photo as:
Construct a frequency distribution table and calculate the mean, median, and mode for the given marks.
Mathematics
ScanSolve AI Answer
Answer
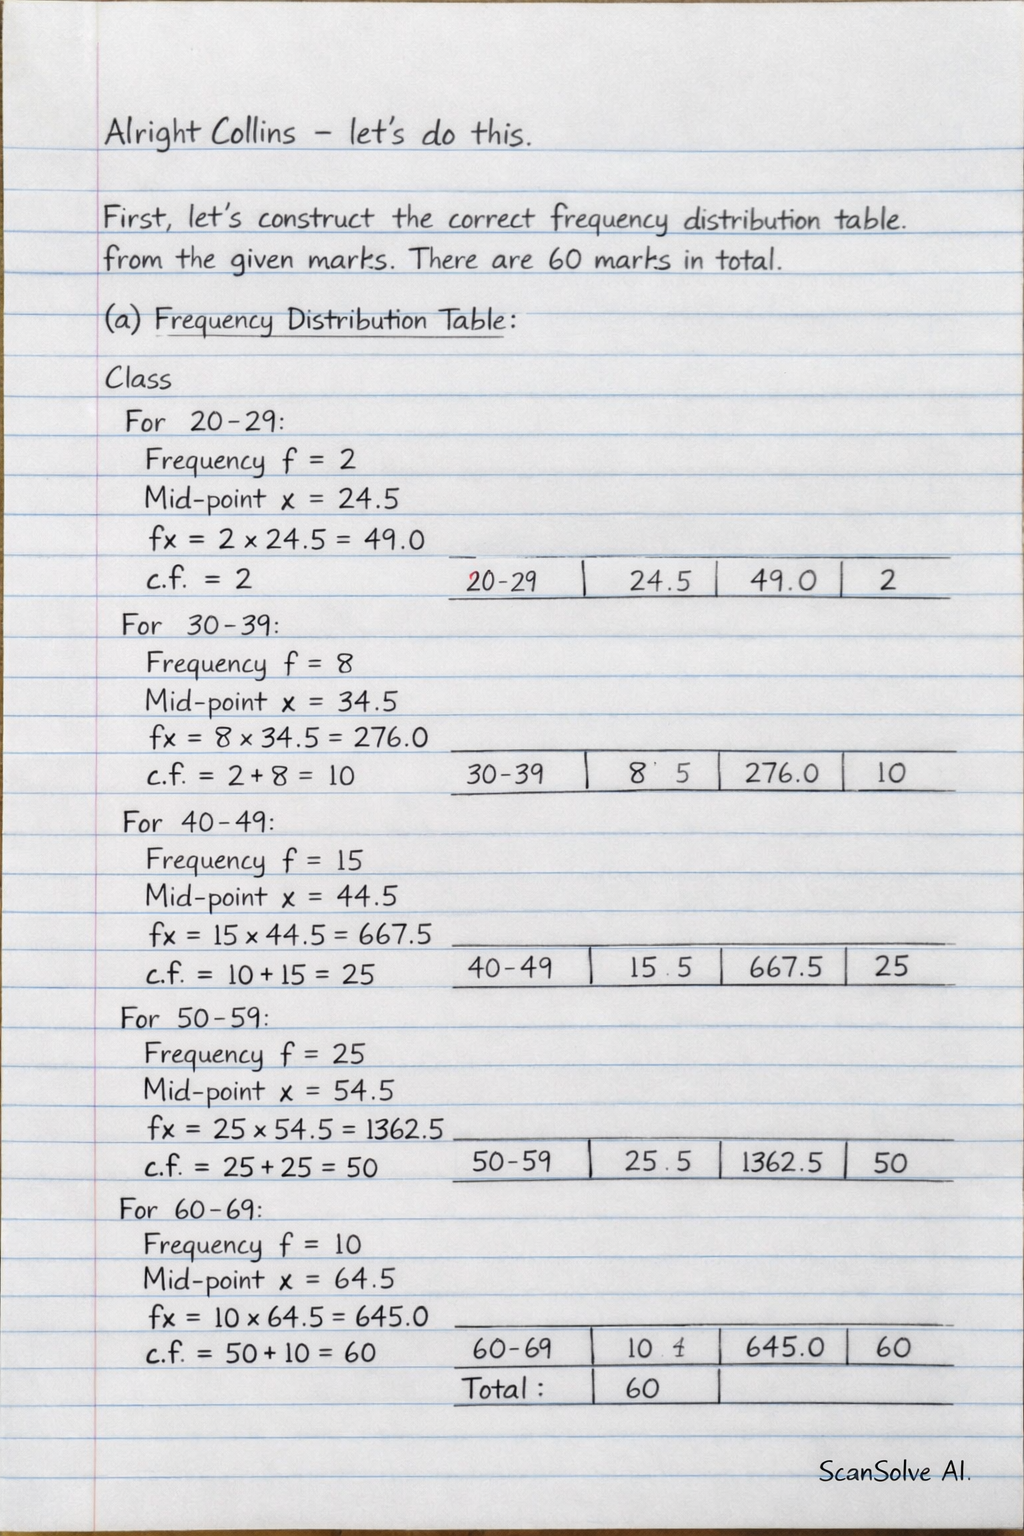
First, let's construct the correct frequency distribution table from the given marks. There are 60 marks in total.
a) Frequency Distribution Table:
| class | Frequency | Mid-point | ||
|---|---|---|---|---|
| 20-29 | 2 | 24.5 | 49.0 | 2 |
| 30-39 | 8 | 34.5 | 276.0 | 10 |
| 40-49 |
Was this helpful?
Still stuck on this one?
Ask a follow-up, and the answer starts from this question.
Got a different question?Ask your own question
More Mathematics Questions
QGiven a frequency distribution table of marks, calculate the mean and variance.QCalculate the mean and cumulative frequency for the given marks using a frequency table.QGiven a frequency distribution table with marks and frequencies, find the median class, class size…QConstruct a grouped frequency distribution table and calculate the mean mark and standard deviation…QCalculate the mean mark of the distribution (correct to one decimal place). Find the median mark…
Browse by topic:Statistics
Handwritten Step-by-Step Solution
Get this as a handwritten image on WhatsApp — like a tutor wrote it for you.
Try on WhatsApp