
This mathematics problem involves applying core mathematical principles and formulas. Below you will find a complete step-by-step solution with detailed explanations for each step, helping you understand not just the answer but the method behind it.
ScanSolve AI Answer
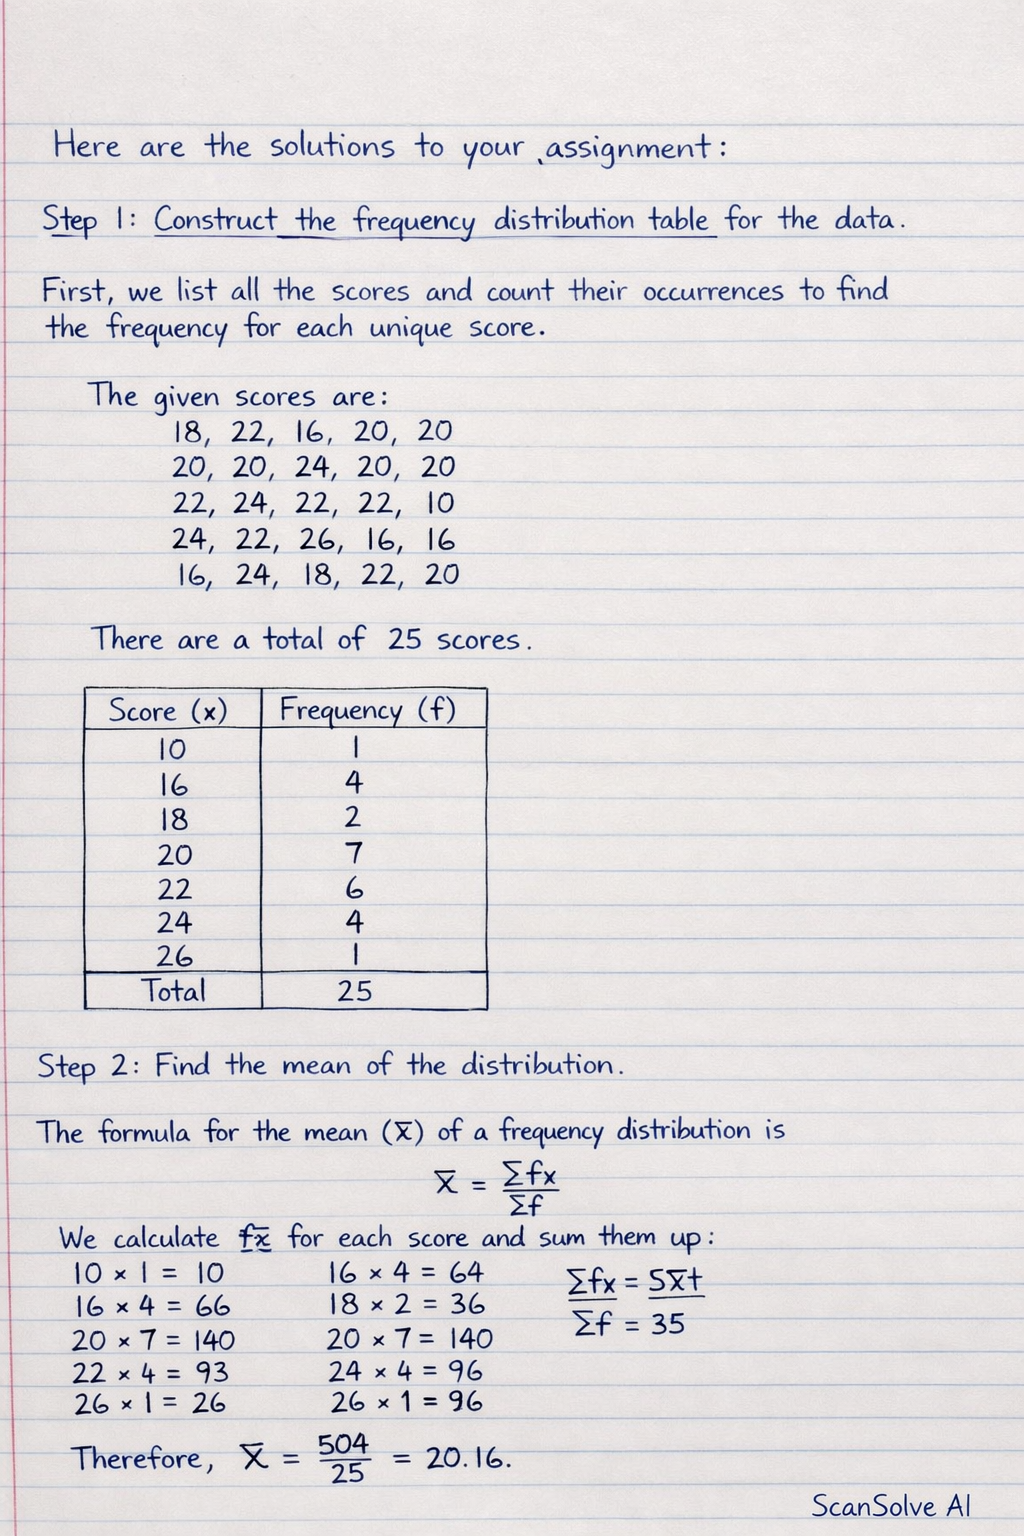
Here are the solutions to your assignment: Step 1: Construct the frequency distribution table for the data. First, we list all the scores and count their occurrences to find the frequency for each unique score. The given scores are: 18, 22, 16, 20, 20 20, 20, 24, 20, 20 22, 24, 22, 22, 10 24, 22, 26, 16, 16 16, 24, 18, 22, 20 There are a total of 25 scores. The frequency distribution table is: |c|c| Score (x) & Frequency (f) \\ 10 & 1 \\ 16 & 4 \\ 18 & 2 \\ 20 & 7 \\ 22 & 6 \\ 24 & 4 \\ 26 & 1 \\ Total & 25 \\ Step 2: Find the mean of the distribution. The formula for the mean (x) of a frequency distribution is x = ( fx)/( f). We calculate fx for each score and sum them up. |c|c|c| Score (x) & Frequency (f) & fx \\ 10 & 1 & 10 × 1 = 10 \\ 16 & 4 & 16 × 4 = 64 \\ 18 & 2 & 18 × 2 = 36 \\ 20 & 7 & 20 × 7 = 140 \\ 22 & 6 & 22 × 6 = 132 \\ 24 & 4 & 24 × 4 = 96 \\ 26 & 1 & 26 × 1 = 26 \\ Total & 25 & fx = 504 \\ Now, we calculate the mean: x = ( fx)/( f) = (504)/(25) = 20.16 The mean of the distribution is 20.16. Step 3: Find the mode of the distribution. The mode is the score that appears most frequently in the distribution. From the frequency table in Step 1, the score with the highest frequency is 20, which has a frequency of 7. The mode of the distribution is 20. Send me the next one 📸