
We read your photo as:
Differentiate between data classification and tabulation; state the importance of tabulation or table in statistics; state the rules for creating frequency distribution table for grouped data.
Mathematics
ScanSolve AI Answer
This answer stops before the end.
It was cut off when it was first written. Ask ScanSolve this question again for the full working.
To construct the frequency distribution table for question 2b, we first need to identify the minimum and maximum values in the given data and then group them into the specified classes.
The data provided is:
534, 531, 535, 532, 545, 512, 544, 538, 528, 524
549, 555, 543, 536, 551, 518, 549, 531, 521, 525
510
Was this helpful?
Still stuck on this one?
Ask a follow-up, and the answer starts from this question.
Got a different question?Ask your own question
More Mathematics Questions
QDescribe basics of statistics Graphical presentation of data Estimation of Mode from Histogram and…QWhat is a frequency distribution table and how are its columns (class interval, frequency, tally…QCreate an extended frequency distribution table for the given data, calculating total frequency…QConstruct a grouped frequency distribution table and calculate the mean mark and standard deviation…QWhat are the steps to verify a frequency distribution table and construct a histogram, and what is…
Browse by topic:Statistics
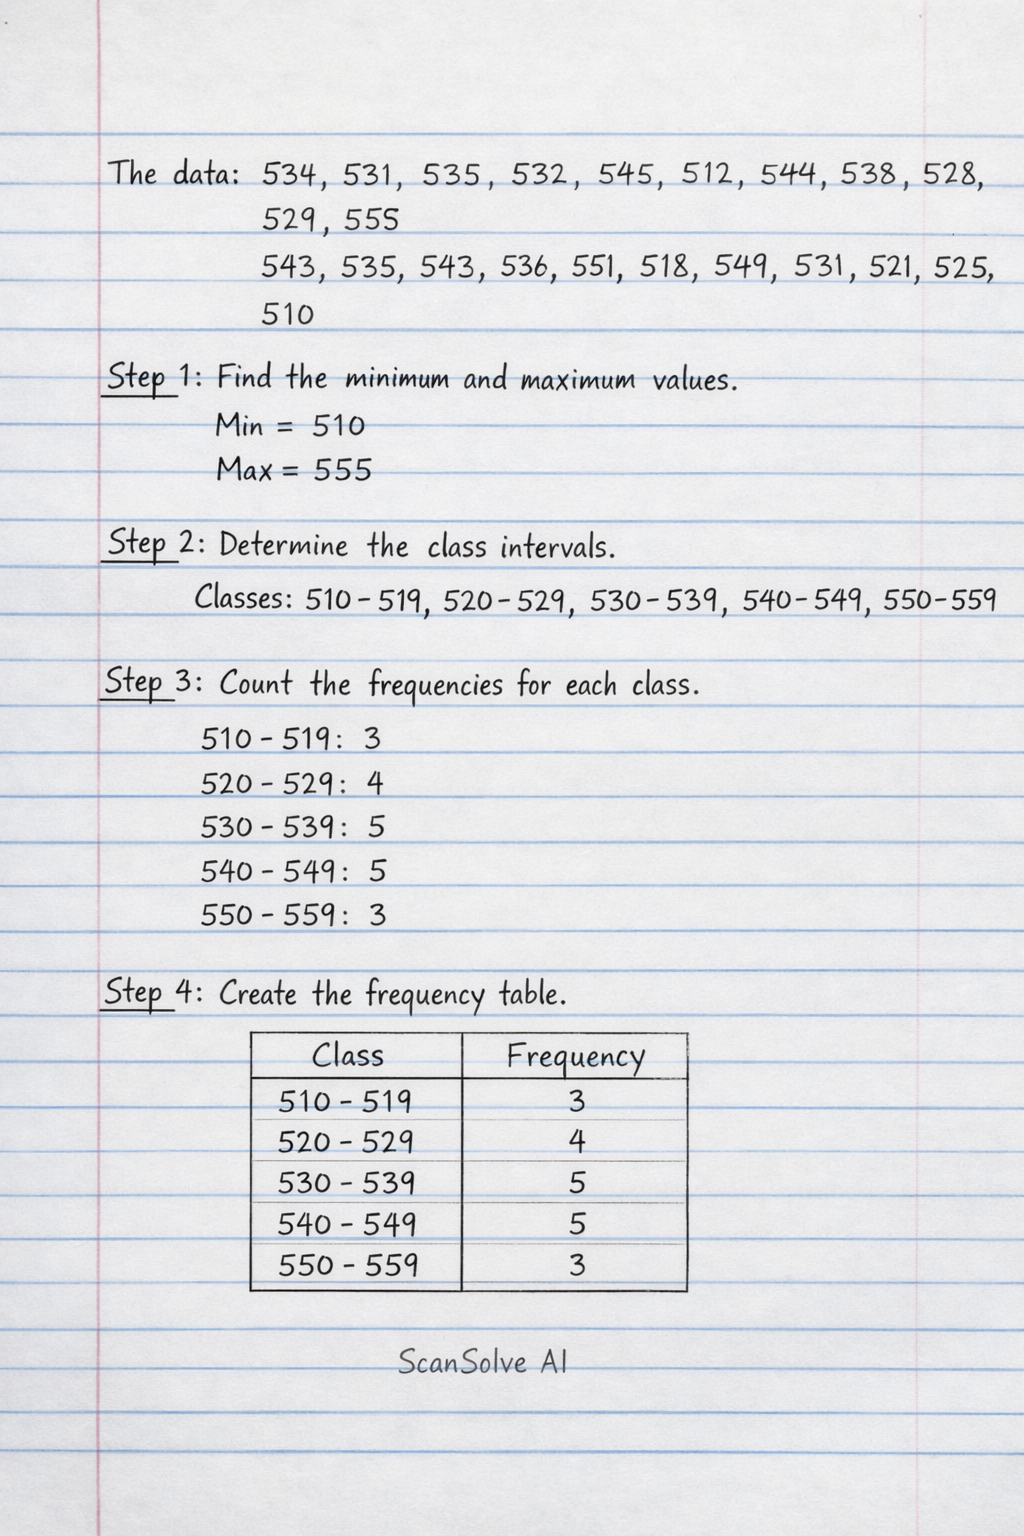
Handwritten Step-by-Step Solution
Get this as a handwritten image on WhatsApp — like a tutor wrote it for you.
Try on WhatsApp