
This mathematics problem involves applying core mathematical principles and formulas. Below you will find a complete step-by-step solution with detailed explanations for each step, helping you understand not just the answer but the method behind it.
ScanSolve AI Answer
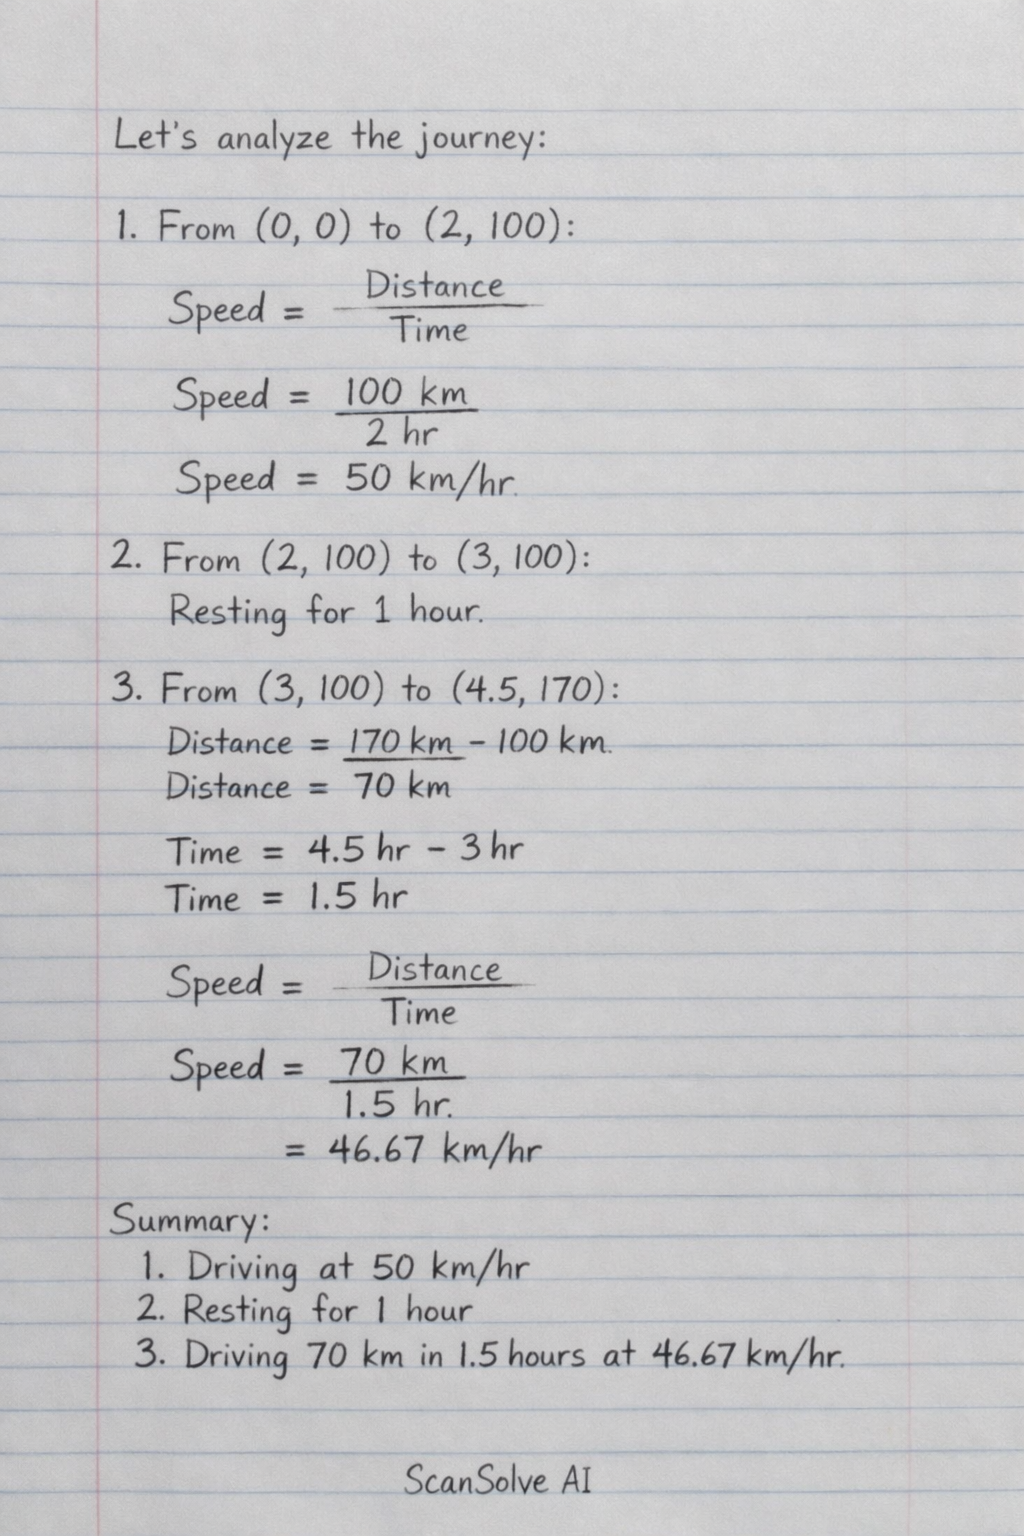
Here is the distance-time graph illustrating the journey described in ITEM 4. ITEM 4: Distance-Time Graph The graph shows the distance covered over time, based on the following segments: • From (0, 0) to (2, 100): Driving at 50 kmh^-1. • From (2, 100) to (3, 100): Resting for 1 hour. • From (3, 100) to (4.5, 170): Driving another 70 km in 1.5 hours. [ xlabel=Time (hours), ylabel=Distance (km), xmin=0, xmax=5, ymin=0, ymax=180, xtick=0, 1, 2, 3, 4, 4.5, 5, ytick=0, 50, 100, 150, 170, grid=both, major grid style=gray!50, axis lines=box, legend pos=north west ] [blue, thick, mark=*, samples=100] coordinates (0, 0) (2, 100) (3, 100) (4.5, 170) ; [above right] at (axis cs:0.5,25) Driving; [above] at (axis cs:2.5,100) Rest; [above left] at (axis cs:3.75,135) Driving; Last free one today — make it count tomorrow, or type /upgrade for unlimited.