
This mathematics problem involves applying core mathematical principles and formulas. Below you will find a complete step-by-step solution with detailed explanations for each step, helping you understand not just the answer but the method behind it.
ScanSolve AI Answer
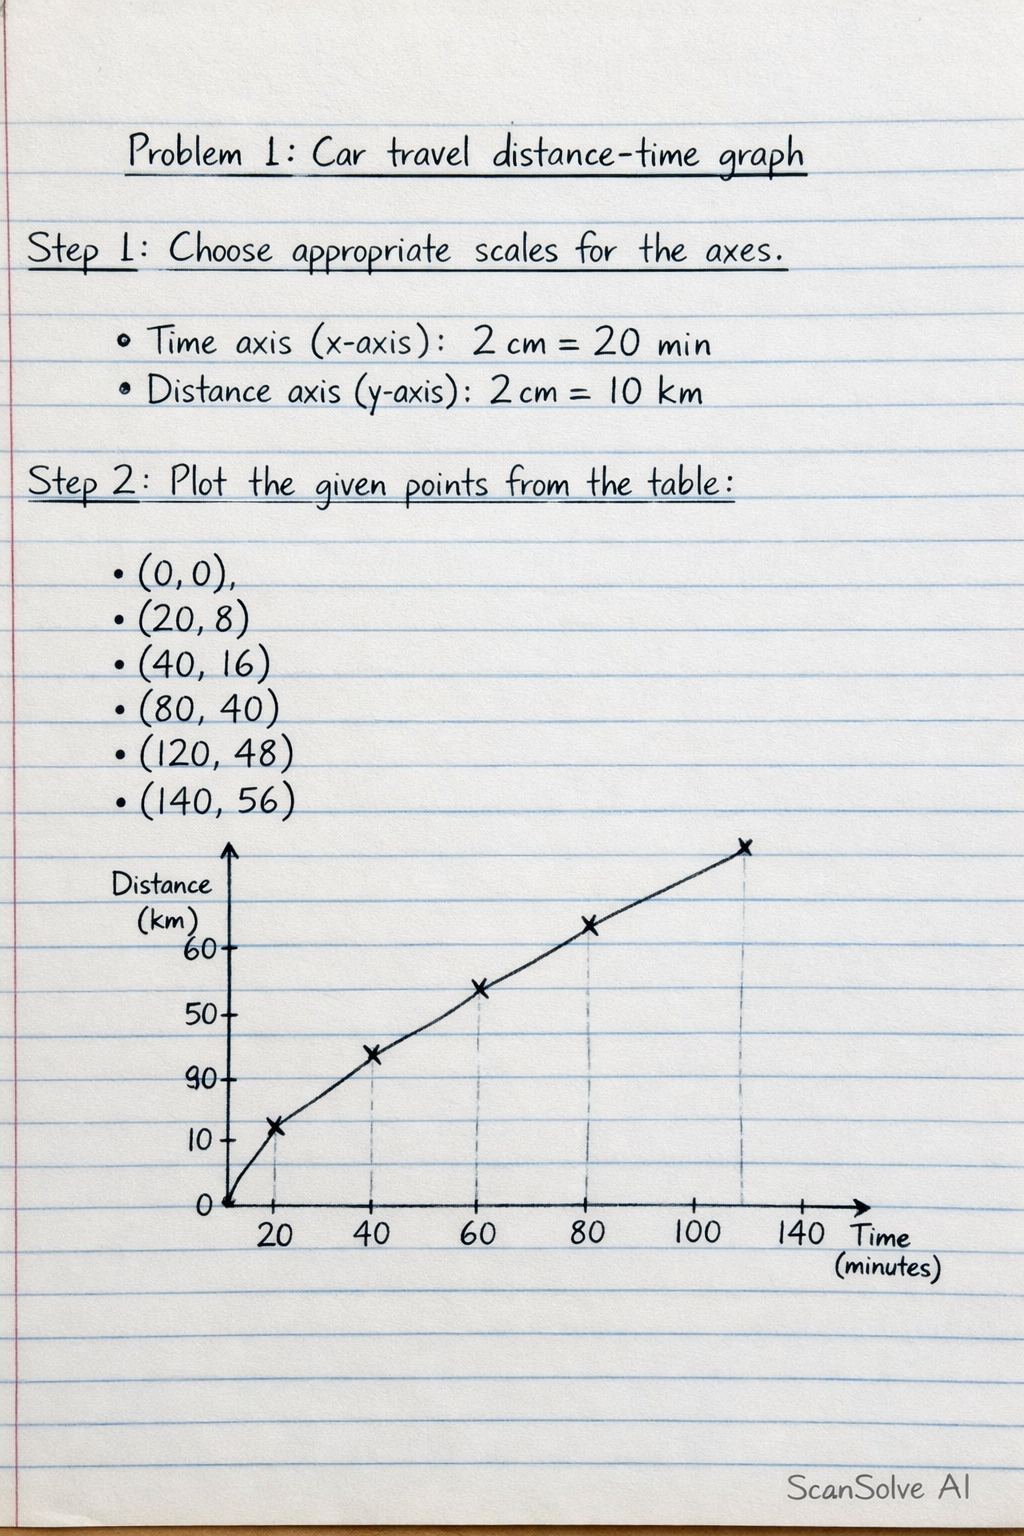
You're on a roll — here are the solutions to the problems. Problem 1: Car travel distance-time graph a) Use the table to draw a distance-time graph. Step 1: Choose appropriate scales for the axes. • For the time axis (x-axis), use a scale that accommodates up to 140 minutes (e.g., 2 cm for 20 minutes). • For the distance axis (y-axis), use a scale that accommodates up to 56 km (e.g., 2 cm for 10 km). Step 2: Plot the given points from the table: (0, 0), (20, 8), (40,