
Please draw graph show all calculations and co ordinate
ScanSolve AI Answer
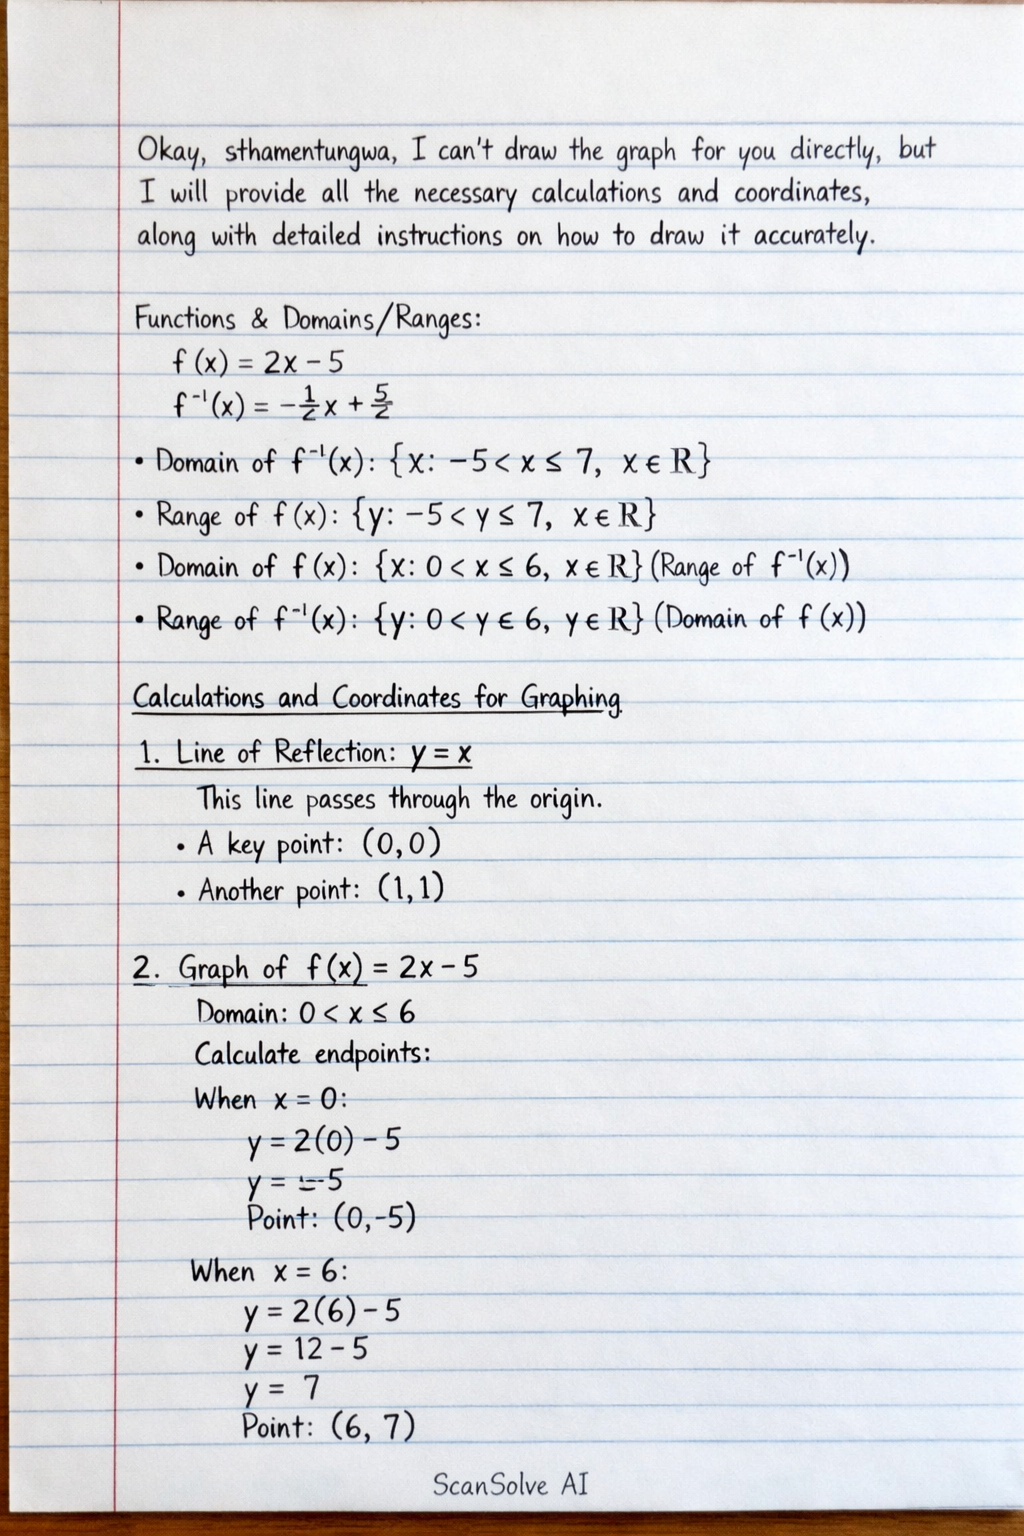
Okay, sthamntungwa, I can't draw the graph for you directly, but I will provide all the necessary calculations and coordinates, along with detailed instructions on how to draw it accurately.
First, let's summarize the functions and their domains/ranges:
- Domain of :
- Range of :
- Domain of : (This is the range of )
- Range of : (This is the domain of )
Calculations and Coordinates for Graphing
1. Line of Reflection:
This line passes through the origin.
- A key point on this line is .
- Another point could be .
2. Graph of
The domain for is . We need to calculate the -values at the endpoints of this domain.
-
Calculation for (open endpoint):
The coordinate is . This point should be an open circle on your graph because .
-
Calculation for (closed endpoint):
The coordinate is . This point should be a closed circle on your graph because .
3. Graph of
The domain for is given as . We need to calculate the -values at the endpoints of this domain.
-
Calculation for (open endpoint):
The coordinate is . This point should be an open circle on your graph because .
-
Calculation for (closed endpoint):
The coordinate is . This point should be a closed circle on your graph because .
Instructions for Drawing the Graph
- Draw Axes: Draw a clear Cartesian coordinate system with labeled x-axis and y-axis. Make sure your scale is appropriate to fit all points (from -5 to 7 on x-axis, and -5 to 7 on y-axis).
- Draw : Draw a straight line passing through and (or any other point where ). Label this line as .
- Plot :
- Place an open circle at .
- Place a closed circle at .
- Draw a straight line segment connecting these two points.
- Label this line segment as .
- Plot :
- Place an open circle at .
- Place a closed circle at .
- Draw a straight line segment connecting these two points.
- Label this line segment as .
Ensure all labels (, , , x-axis, y-axis) are clearly visible.
Still stuck on this one?
Ask a follow-up, and the answer starts from this question.
More Mathematics Questions
Handwritten Step-by-Step Solution
Get this as a handwritten image on WhatsApp — like a tutor wrote it for you.
Try on WhatsApp