
We read your photo as:
Equation 3: y = -2x + 2. In this phase, you will translate your numerical data into a visual format to identify trends. Draw a Cartesian plane on graph paper provided. Set your x-axis from -5 to 5 and your y-axis from -5 to 5.
Mathematics
ScanSolve AI Answer
Answer
Step-by-step solution
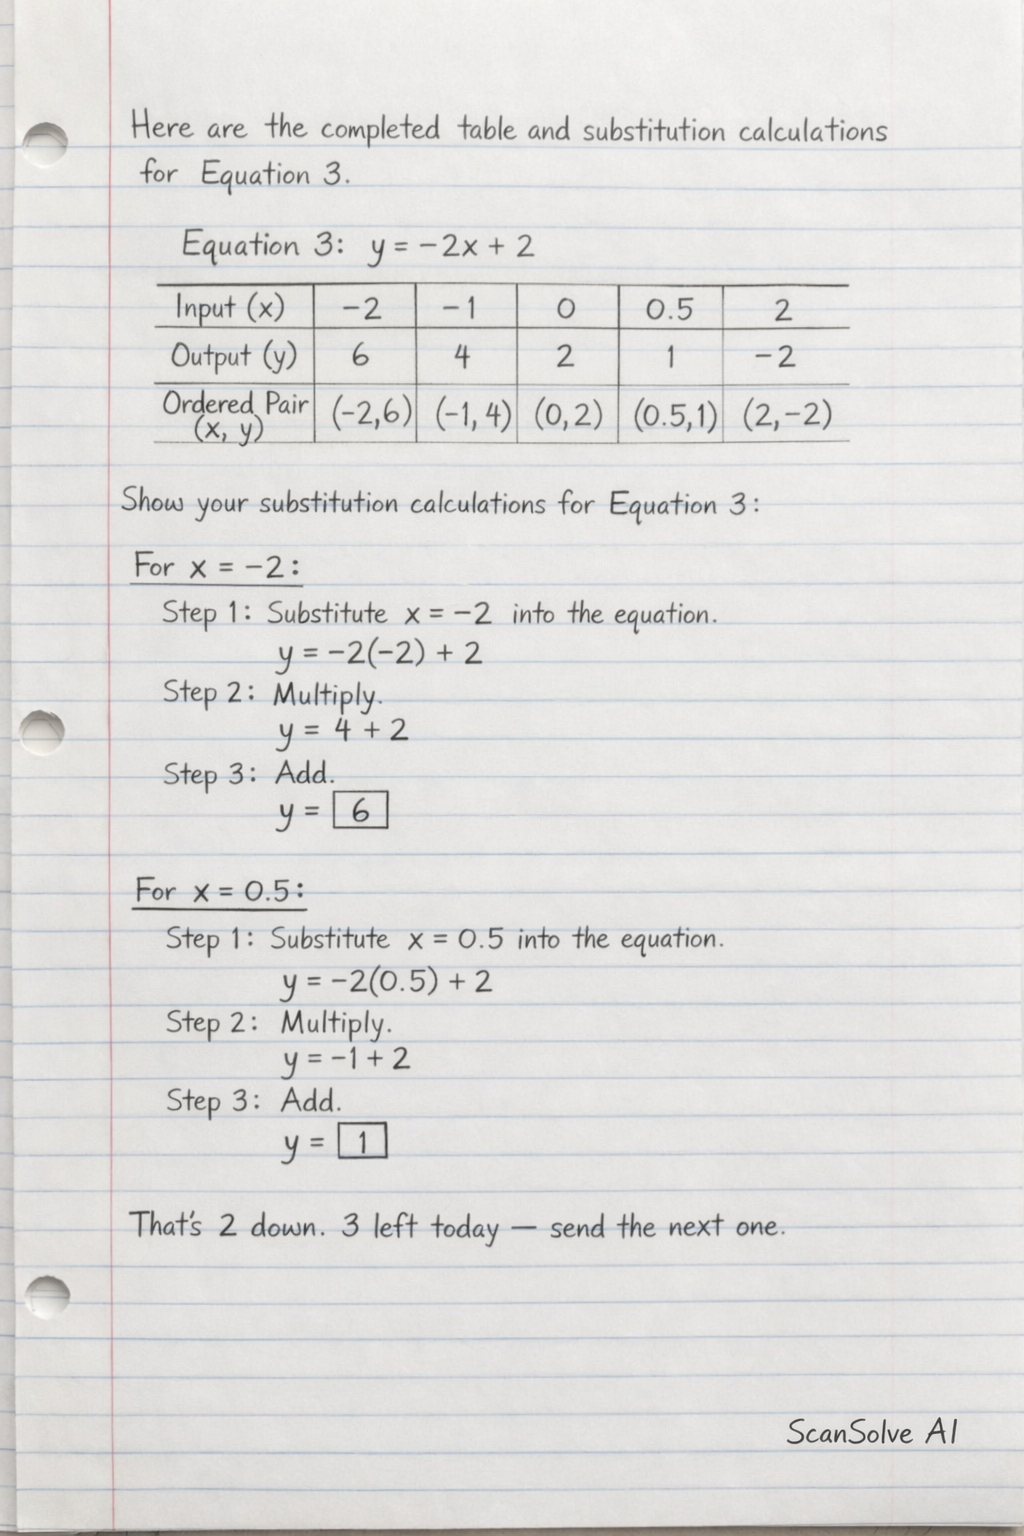
6 stepsHere are the completed table and substitution calculations for Equation 3.
Equation 3:
| Input (x) | -2 | -1 | 0 | 0.5 | 2 |
|---|---|---|---|---|---|
| Output (y) | 6 | 4 | 2 | 1 | -2 |
| Ordered Pair (x; y) | (-2; 6) | (-1; 4) | (0; 2) | (0.5; 1) | (2; -2) |
Show your substitution calculations for Equation 3:
- x = -2:
Substitute into the equation.
$$ y = -2(-2) + 2 $$Multiply.
$$ y = 4 + 2 $$Add.
$$ y = \boxed{6} $$- x = 0.5:
Substitute into the equation.
$$ y = -2(0.5) + 2 $$Multiply.
$$ y = -1 + 2 $$Add.
$$
y = \boxed{1}
$$
Was this helpful?
Try one yourself
A new problem that tests the same skill.
Still stuck on this one?
Ask a follow-up, and the answer starts from this question.
Got a different question?Ask your own question
More Mathematics Questions
QComplete Table 2 on the relation y = −2x + 3, for the values of x from −3 to +5. (b) Use a scale of…QDraw the graph for the equation y = 2x2 - 5x − 3 for x from −2 to +6 using a scale of 2cm to 1 unit…QCreate a table and graph for the relation y = 3x − 2 for x = −2, −1, 0, 1, 2. Use the graph to find…QComplete the tables below by determining the values for each equation. Plot each point (x, y) on the…QUsing a Scale of 2cm to 1unit on the x-axis and 2cm to 5units on the y-axis, draw the graph of x2…
Handwritten Step-by-Step Solution
Get this as a handwritten image on WhatsApp — like a tutor wrote it for you.
Try on WhatsApp