
We read your photo as:
Using a Scale of 2cm to 1unit on the x-axis and 2cm to 5units on the y-axis, draw the graph of x2 - 2x - 2.
ScanSolve AI Answer
Use the left and right arrow keys to trace the curve, up and down to jump between key points, and plus and minus to zoom.
| Point | x | y |
|---|---|---|
| x-intercept | −0.73 | 0 |
| y-intercept | 0 | −2 |
| Minimum | 1 | −3 |
| x-intercept | 2.73 | 0 |
Step-by-step solution
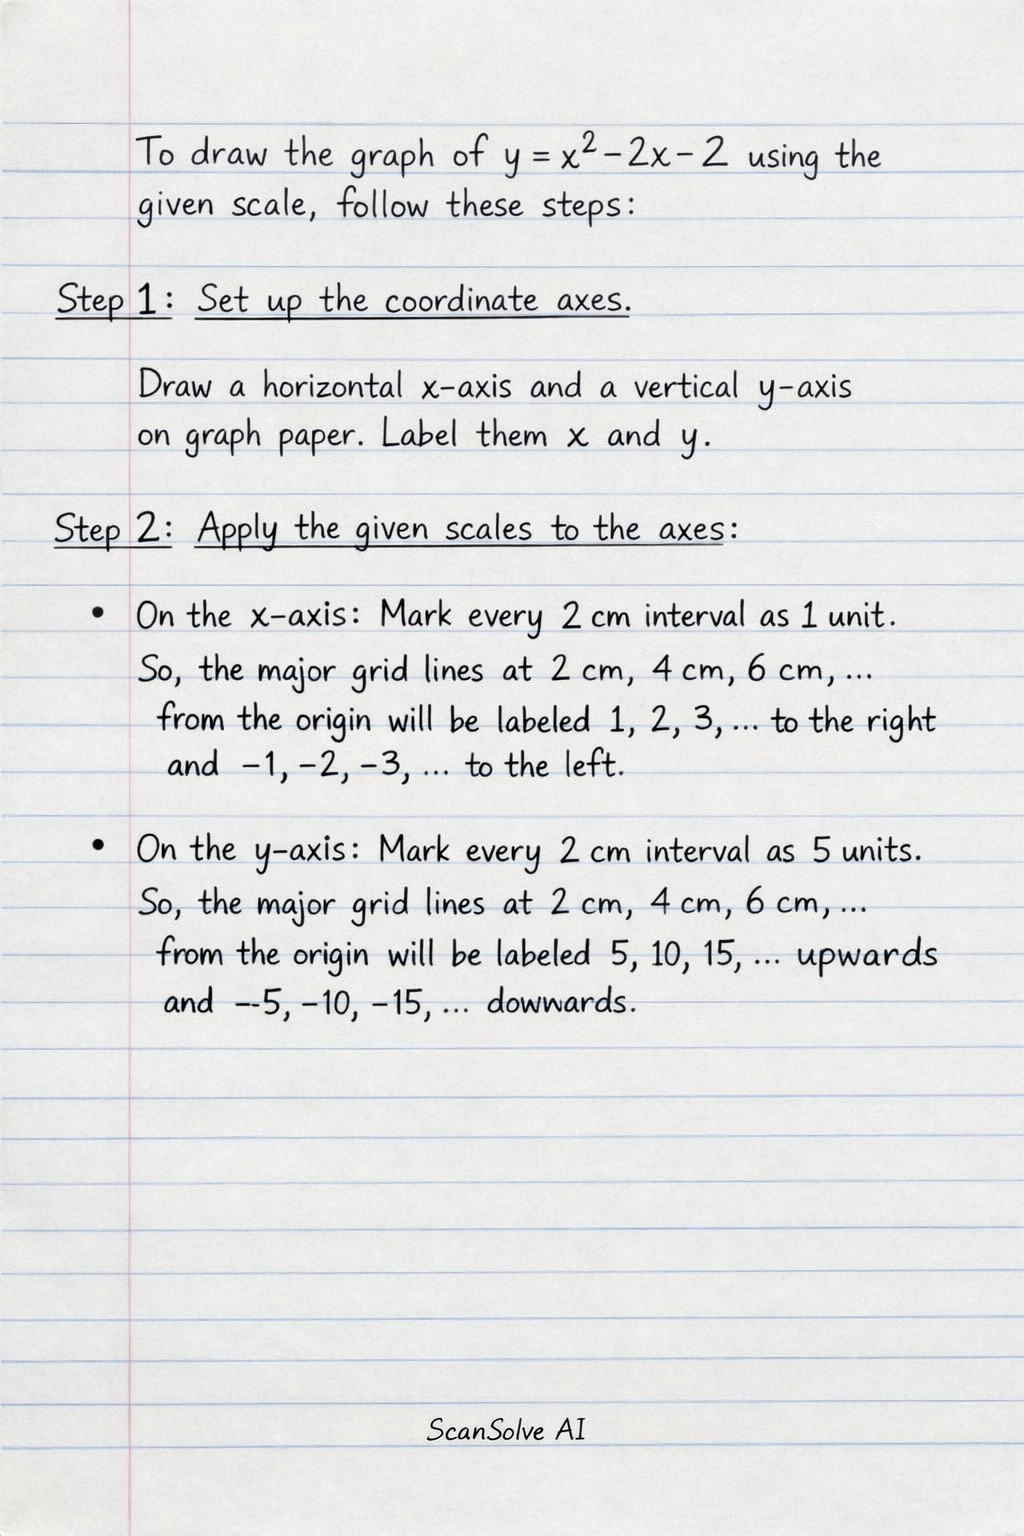
4 stepsTo draw the graph of using the given scale, follow these steps:
Set up the coordinate axes.
Draw a horizontal -axis and a vertical -axis on graph paper. Label them and respectively.
Apply the given scales to the axes.
- On the -axis: Mark every interval as . So, the major grid lines at from the origin will be labeled to the right and to the left.
- On the -axis: Mark every interval as . So, the major grid lines at from the origin will be labeled upwards and downwards.
Plot the points from the table.
Using the table of values from the previous part:
Plot each pair on your graph paper according to the scales defined in Step 2. For example, to plot :
- Move 4 units to the left on the -axis (which is to the left).
- Move 22 units up on the -axis (which is up).
Draw a smooth curve.
Once all points are plotted, draw a smooth, continuous curve through them. This curve will be a parabola, representing the graph of .
Since I cannot physically draw the graph, these instructions explain how to construct it.
Still stuck on this one?
Ask a follow-up, and the answer starts from this question.
More Mathematics Questions
Handwritten Step-by-Step Solution
Get this as a handwritten image on WhatsApp — like a tutor wrote it for you.
Try on WhatsApp