
We read your photo as:
For each equation, complete the table of values and draw its graph for values of x from -2 to 2. a) y = 3x + 3 b) y = x − 9
ScanSolve AI Answer
Step-by-step solution
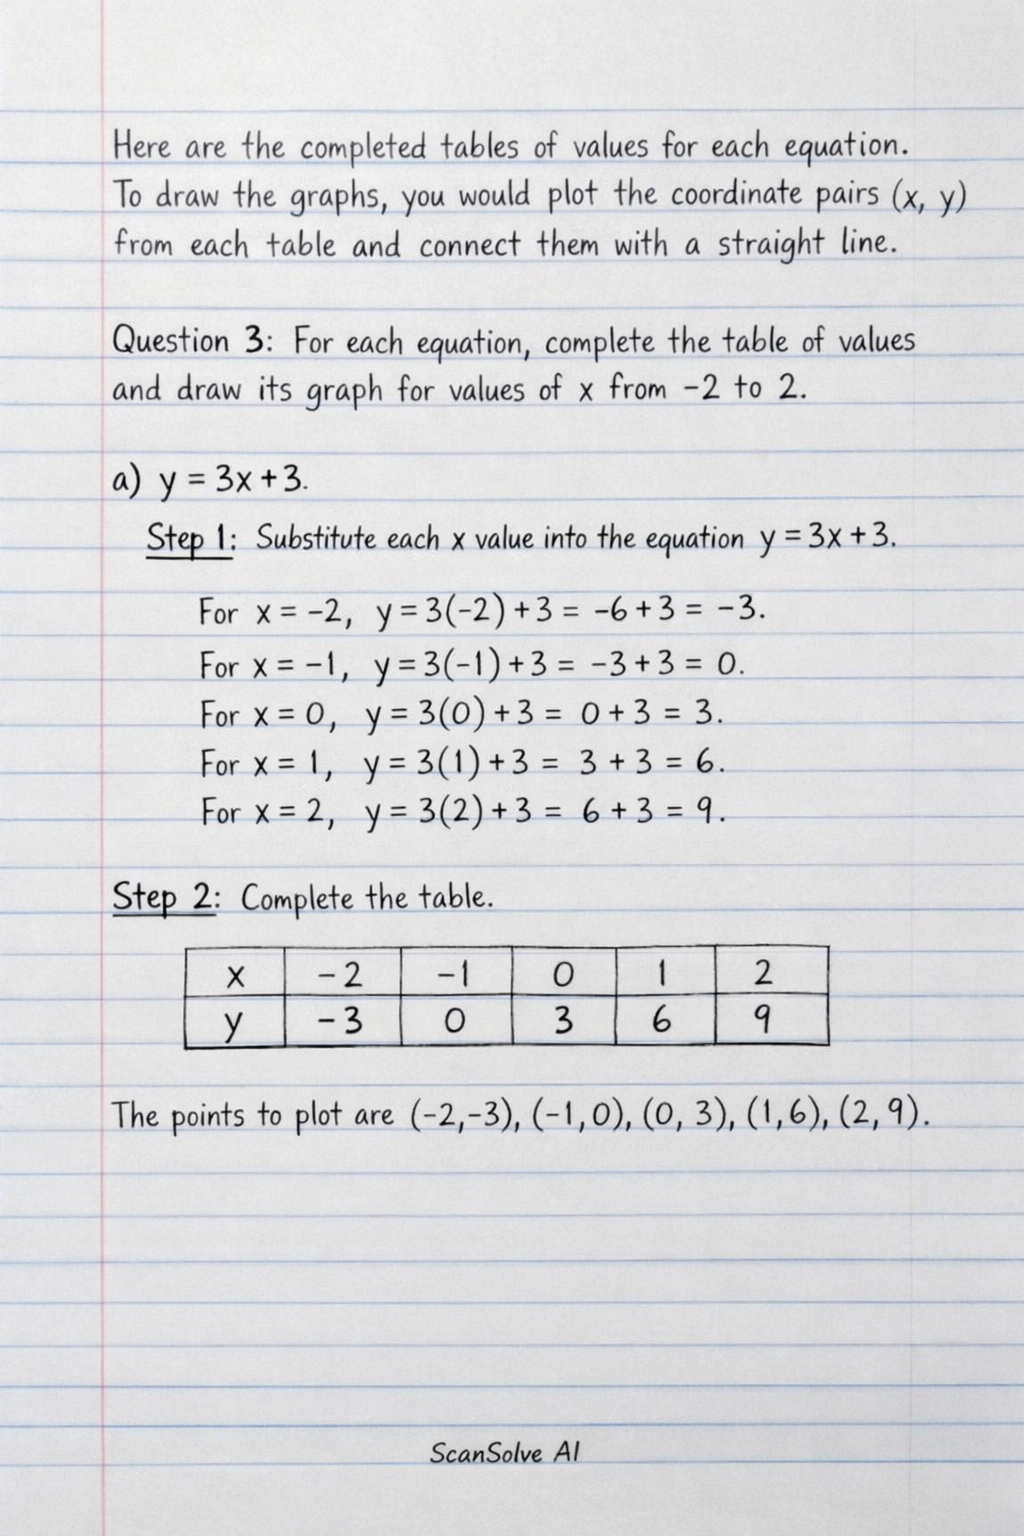
13 stepsHere are the completed tables of values for each equation. To draw the graphs, you would plot the coordinate pairs $(x, y)$ from each table and connect them with a straight line.
Part 3· 8 steps
For each equation, complete the table of values and draw its graph for values of from to 2.
- a)
Substitute each value into the equation .
For $x = -2$, $y = 3(-2) + 3 = -6 + 3 = -3$. For $x = -1$, $y = 3(-1) + 3 = -3 + 3 = 0$. For $x = 0$, $y = 3(0) + 3 = 0 + 3 = 3$. For $x = 1$, $y = 3(1) + 3 = 3 + 3 = 6$. For $x = 2$, $y = 3(2) + 3 = 6 + 3 = 9$.Complete the table.
$$ \begin{array}{|c|c|c|c|c|c|} \hline x & -2 & -1 & 0 & 1 & 2 \\ \hline y & \textbf{-3} & \textbf{0} & \textbf{3} & \textbf{6} & \textbf{9} \\ \hline \end{array} $$ The points to plot are $(-2, -3)$, $(-1, 0)$, $(0, 3)$, $(1, 6)$, $(2, 9)$.- b)
Substitute each value into the equation .
For $x = -2$, $y = -2 - 9 = -11$. For $x = -1$, $y = -1 - 9 = -10$. For $x = 0$, $y = 0 - 9 = -9$. For $x = 1$, $y = 1 - 9 = -8$. For $x = 2$, $y = 2 - 9 = -7$.Complete the table.
$$ \begin{array}{|c|c|c|c|c|c|} \hline x & -2 & -1 & 0 & 1 & 2 \\ \hline y & \textbf{-11} & \textbf{-10} & \textbf{-9} & \textbf{-8} & \textbf{-7} \\ \hline \end{array} $$ The points to plot are $(-2, -11)$, $(-1, -10)$, $(0, -9)$, $(1, -8)$, $(2, -7)$.- c)
Substitute each value into the equation .
For $x = -2$, $y = -2 - 2 = -4$. For $x = -1$, $y = -1 - 2 = -3$. For $x = 0$, $y = 0 - 2 = -2$. For $x = 1$, $y = 1 - 2 = -1$. For $x = 2$, $y = 2 - 2 = 0$.Complete the table.
$$ \begin{array}{|c|c|c|c|c|c|} \hline x & -2 & -1 & 0 & 1 & 2 \\ \hline y & \textbf{-4} & \textbf{-3} & \textbf{-2} & \textbf{-1} & \textbf{0} \\ \hline \end{array} $$ The points to plot are $(-2, -4)$, $(-1, -3)$, $(0, -2)$, $(1, -1)$, $(2, 0)$.- d)
Substitute each value into the equation .
For $x = -2$, $y = -2$. For $x = -1$, $y = -1$. For $x = 0$, $y = 0$. For $x = 1$, $y = 1$. For $x = 2$, $y = 2$.Complete the table.
$$
\begin{array}{|c|c|c|c|c|c|}
\hline
x & -2 & -1 & 0 & 1 & 2 \\
\hline
y & \textbf{-2} & \textbf{-1} & \textbf{0} & \textbf{1} & \textbf{2} \\
\hline
\end{array}
$$
The points to plot are $(-2, -2)$, $(-1, -1)$, $(0, 0)$, $(1, 1)$, $(2, 2)$.
Part 4· 5 steps
For each equation, complete the table of values and draw its graph for values of from to 4.
- a)
Substitute each value into the equation .
For $x = -2$, $y = \frac{1}{2}(-2) + 1 = -1 + 1 = 0$. For $x = -1$, $y = \frac{1}{2}(-1) + 1 = -0.5 + 1 = 0.5$. For $x = 0$, $y = \frac{1}{2}(0) + 1 = 0 + 1 = 1$. For $x = 1$, $y = \frac{1}{2}(1) + 1 = 0.5 + 1 = 1.5$. For $x = 2$, $y = \frac{1}{2}(2) + 1 = 1 + 1 = 2$. For $x = 3$, $y = \frac{1}{2}(3) + 1 = 1.5 + 1 = 2.5$. For $x = 4$, $y = \frac{1}{2}(4) + 1 = 2 + 1 = 3$.Complete the table.
$$ \begin{array}{|c|c|c|c|c|c|c|c|} \hline x & -2 & -1 & 0 & 1 & 2 & 3 & 4 \\ \hline y & \textbf{0} & \textbf{0.5} & \textbf{1} & \textbf{1.5} & \textbf{2} & \textbf{2.5} & \textbf{3} \\ \hline \end{array} $$ The points to plot are $(-2, 0)$, $(-1, 0.5)$, $(0, 1)$, $(1, 1.5)$, $(2, 2)$, $(3, 2.5)$, $(4, 3)$.- b)
Substitute each value into the equation .
For $x = -2$, $y = \frac{1}{4}(-2) + 5 = -0.5 + 5 = 4.5$. For $x = -1$, $y = \frac{1}{4}(-1) + 5 = -0.25 + 5 = 4.75$. For $x = 0$, $y = \frac{1}{4}(0) + 5 = 0 + 5 = 5$. For $x = 1$, $y = \frac{1}{4}(1) + 5 = 0.25 + 5 = 5.25$. For $x = 2$, $y = \frac{1}{4}(2) + 5 = 0.5 + 5 = 5.5$. For $x = 3$, $y = \frac{1}{4}(3) + 5 = 0.75 + 5 = 5.75$. For $x = 4$, $y = \frac{1}{4}(4) + 5 = 1 + 5 = 6$.Complete the table.
$$ \begin{array}{|c|c|c|c|c|c|c|c|} \hline x & -2 & -1 & 0 & 1 & 2 & 3 & 4 \\ \hline y & \textbf{4.5} & \textbf{4.75} & \textbf{5} & \textbf{5.25} & \textbf{5.5} & \textbf{5.75} & \textbf{6} \\ \hline \end{array} $$ The points to plot are $(-2, 4.5)$, $(-1, 4.75)$, $(0, 5)$, $(1, 5.25)$, $(2, 5.5)$, $(3, 5.75)$, $(4, 6)$.- c)
Substitute each value into the equation .
For $x = -2$, $y = \frac{1}{3}(-2) + 1 = -\frac{2}{3} + 1 = \frac{1}{3}$.
For $x = -1$, $y = \frac{1}{3}(-1) + 1 = -\frac{1}{3} + 1 = \frac{2}{3}$.
For $x = 0$, $y = \frac{1}{3}(0) + 1 = 0 + 1 = 1$.
For $x = 1$, $y = \frac{1}{3}(1) + 1 = \frac{1}{3} + 1 = \frac{4}{3}$.
For $x = 2$, $y = \frac{1}{3}(2) + 1 = \frac{2}{3} + 1 = \frac{5}{3}$.
For $x = 3$, $y = \frac{1}{3}(3) + 1 = 1 + 1 = 2$.
For $x = 4$,
Still stuck on this one?
Ask a follow-up, and the answer starts from this question.
More Mathematics Questions
Handwritten Step-by-Step Solution
Get this as a handwritten image on WhatsApp — like a tutor wrote it for you.
Try on WhatsApp