
We read your photo as:
Solve for the missing values in the given grids and analyze the pie chart data for months March and April.
ScanSolve AI Answer
Step-by-step solution
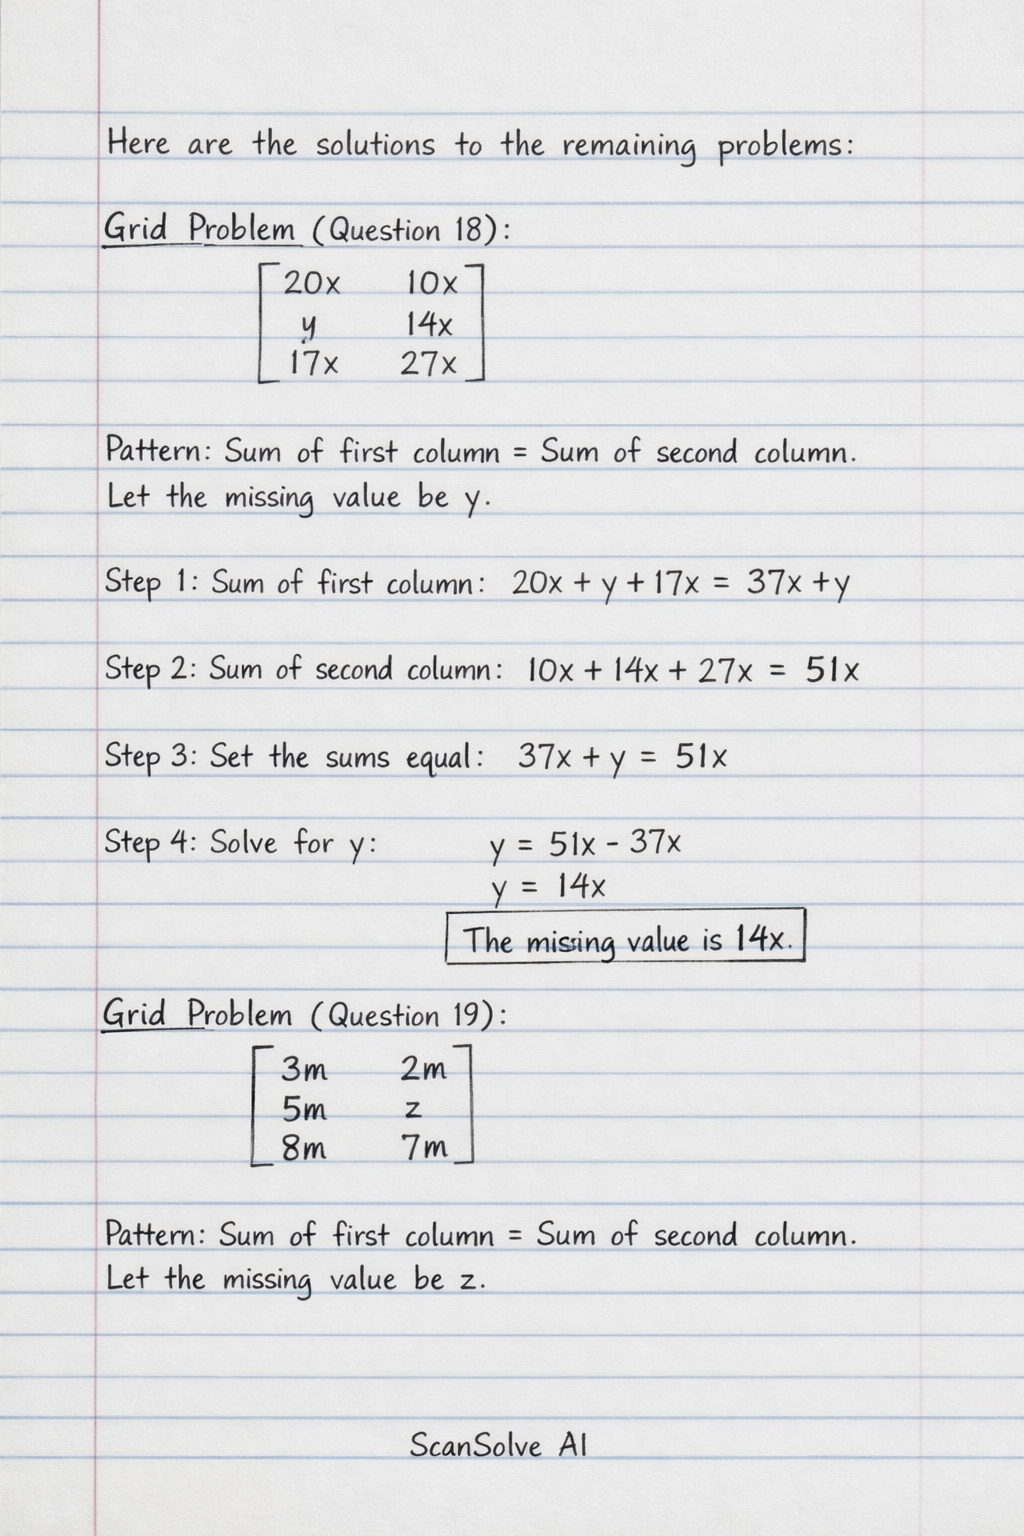
10 stepshere are the solutions to the remaining problems:
Grid Problem (Question 18):
The grid is:
The pattern is that the sum of the numbers in the first column is equal to the sum of the numbers in the second column.
Let the missing value be .
Calculate the sum of the first column.
Calculate the sum of the second column.
Equate the sums of the columns.
Solve for .
The missing value is .
Grid Problem (Question 19):
The grid is:The pattern is that the sum of the numbers in the first column is equal to the sum of the numbers in the second column.
Let the missing value be .Calculate the sum of the first column.
Calculate the sum of the second column.
Equate the sums of the columns.
Solve for .
The missing value is .
Pie Chart Analysis:
The pie chart shows 720 children born between January and May 2001.Determine the angle for each month.
- March: (given)
- April: (given)
- February: The right angle symbol between Feb and March indicates that the angle for February is .
- January: The right angle symbol between Jan and May indicates that the angle for January is .
- May: The sum of angles in a circle is . Sum of known angles = Angle(Jan) + Angle(Feb) + Angle(March) + Angle(April) Angle(May) = .
Calculate the number of children for each month.
The total number of children is 720, corresponding to .
Number of children per degree = children per degree.- Children in January:
- Children in February:
- Children in March:
- Children in April:
- Children in May:
Still stuck on this one?
Ask a follow-up, and the answer starts from this question.
More Mathematics Questions
Handwritten Step-by-Step Solution
Get this as a handwritten image on WhatsApp — like a tutor wrote it for you.
Try on WhatsApp