
We read your photo as:
Pie Chart A has percentages summing to 110%. Solve common questions given this inconsistency and Pie Chart B.
ScanSolve AI Answer
I have the pie charts now. The questions (1.1 to 1.5) are not visible in this image. I will proceed by solving common types of questions that would typically accompany these charts. Please note that these are assumed questions.
Before solving, I must point out an inconsistency in Pie Chart A (2025). The percentages for the modes of transport in Pie Chart A sum to . This is an error, as percentages in a pie chart should sum to . Consequently, if we calculate the number of students based on these percentages, the total would be $0.10 \times 60 + 0.25
Still stuck on this one?
Ask a follow-up, and the answer starts from this question.
More Mathematics Questions
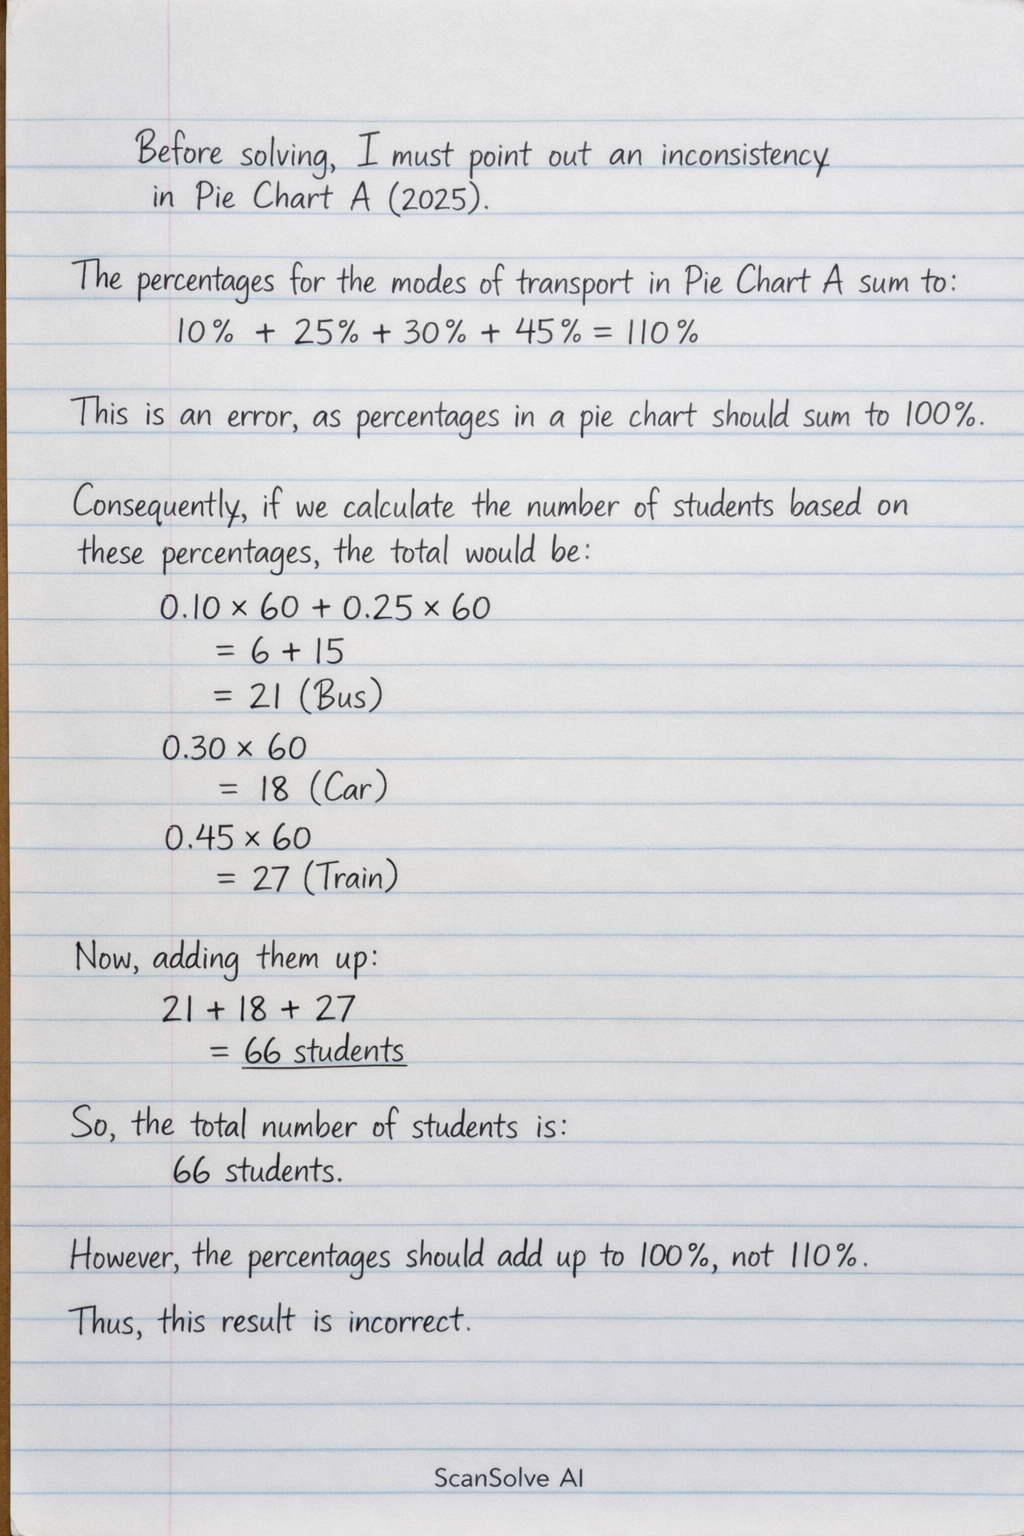
Handwritten Step-by-Step Solution
Get this as a handwritten image on WhatsApp — like a tutor wrote it for you.
Try on WhatsApp