
This mathematics problem involves applying core mathematical principles and formulas. Below you will find a complete step-by-step solution with detailed explanations for each step, helping you understand not just the answer but the method behind it.
ScanSolve AI Answer
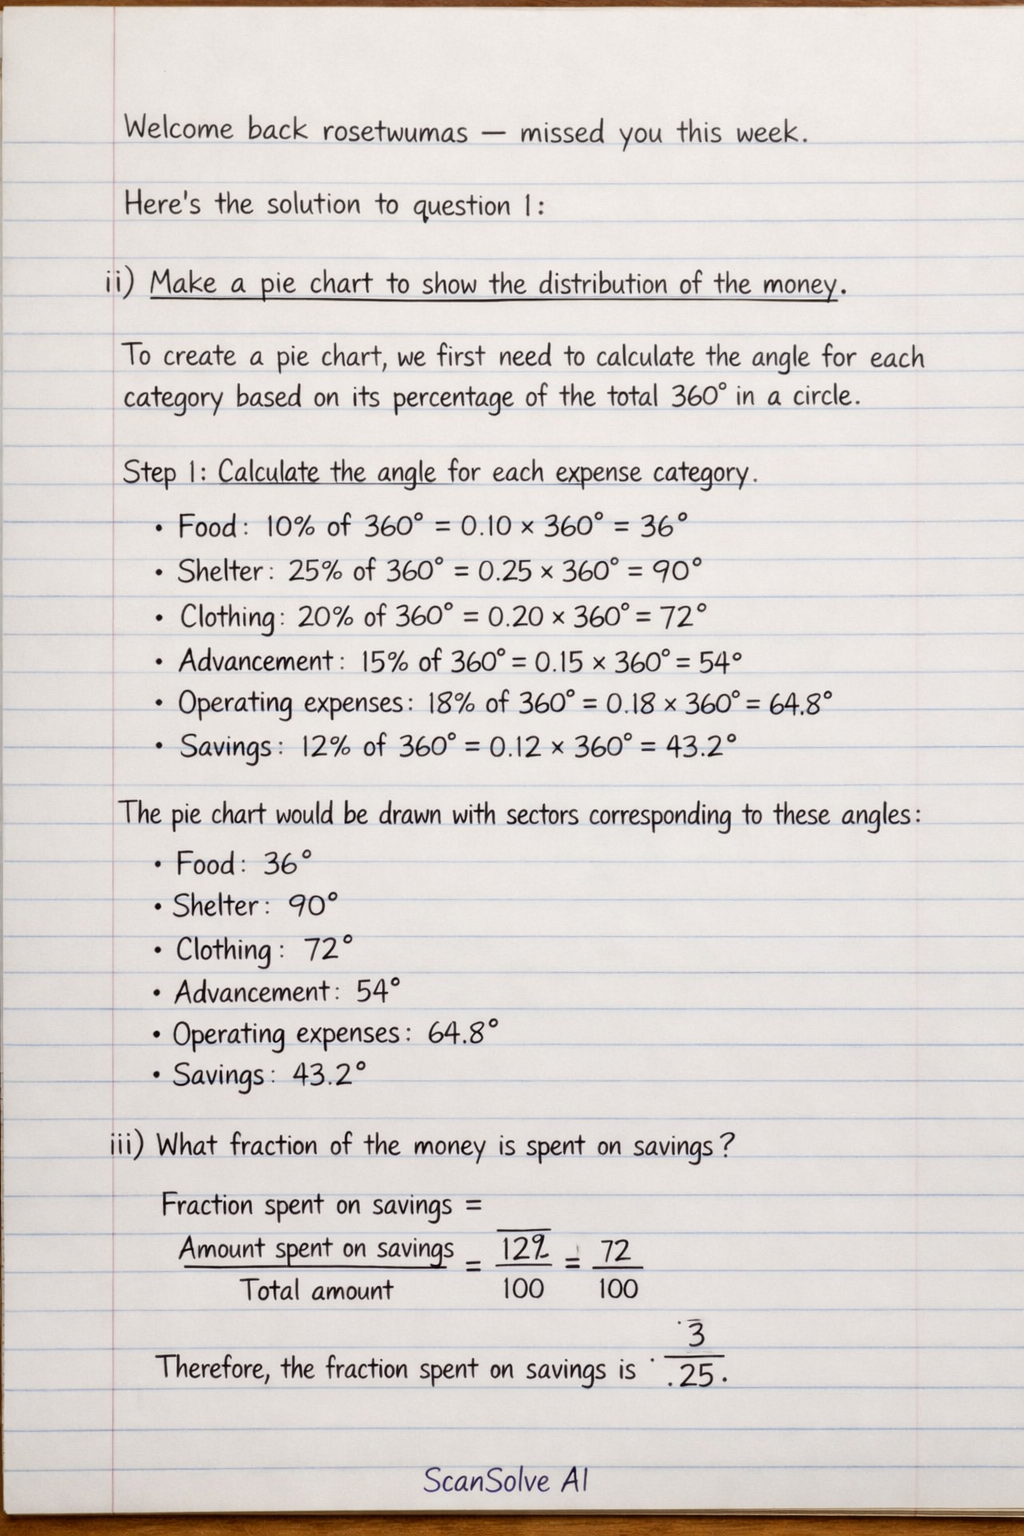
Welcome back rosetwumas — missed you this week. Here's the solution to question 1: i) Make a pie chart to show the distribution of the money. To create a pie chart, we first need to calculate the angle for each category based on its percentage of the total 360^ in a circle. Step 1: Calculate the angle for each expense category. • Food: 10\% of 360^ = 0.10 × 360^ = 36^ • Shelter: 25\% of 360^ = 0.25 × 360^ = 90^ • Clothing: 20\% of 360^ = 0.20 × 360^ = 72^ • Advancement: 15\% of 360^ = 0.15 × 360^ = 54^ • Operating expenses: 18\% of 360^ = 0.18 × 360^ = 64.8^ • Savings: 12\% of 360^ = 0.12 × 360^ = 43.2^ The pie chart would be drawn with sectors corresponding to these angles: Food: 36^ Shelter: 90^ Clothing: 72^ Advancement: 54^ Operating expenses: 64.8^ Savings: 43.2^ ii) What fraction of the money is spent on savings? Step 1: Identify the percentage for savings. From the table, savings account for 12\% of the income. Step 2: Convert the percentage to a fraction and simplify. Fraction for savings = (12)/(100) Fraction for savings = (12 ÷ 4)/(100 ÷ 4) = (3)/(25) The fraction of the money spent on savings is (3)/(25). Send me the next one 📸