
We read your photo as:
Calculate the angles for each expenditure category for Family A to create a pie diagram.
Mathematics
ScanSolve AI Answer
Answer
To prepare a pie diagram, we need to calculate the total expenditure for each family and then determine the angle for each item's sector in the circle. A full circle represents .
Step-by-step solution
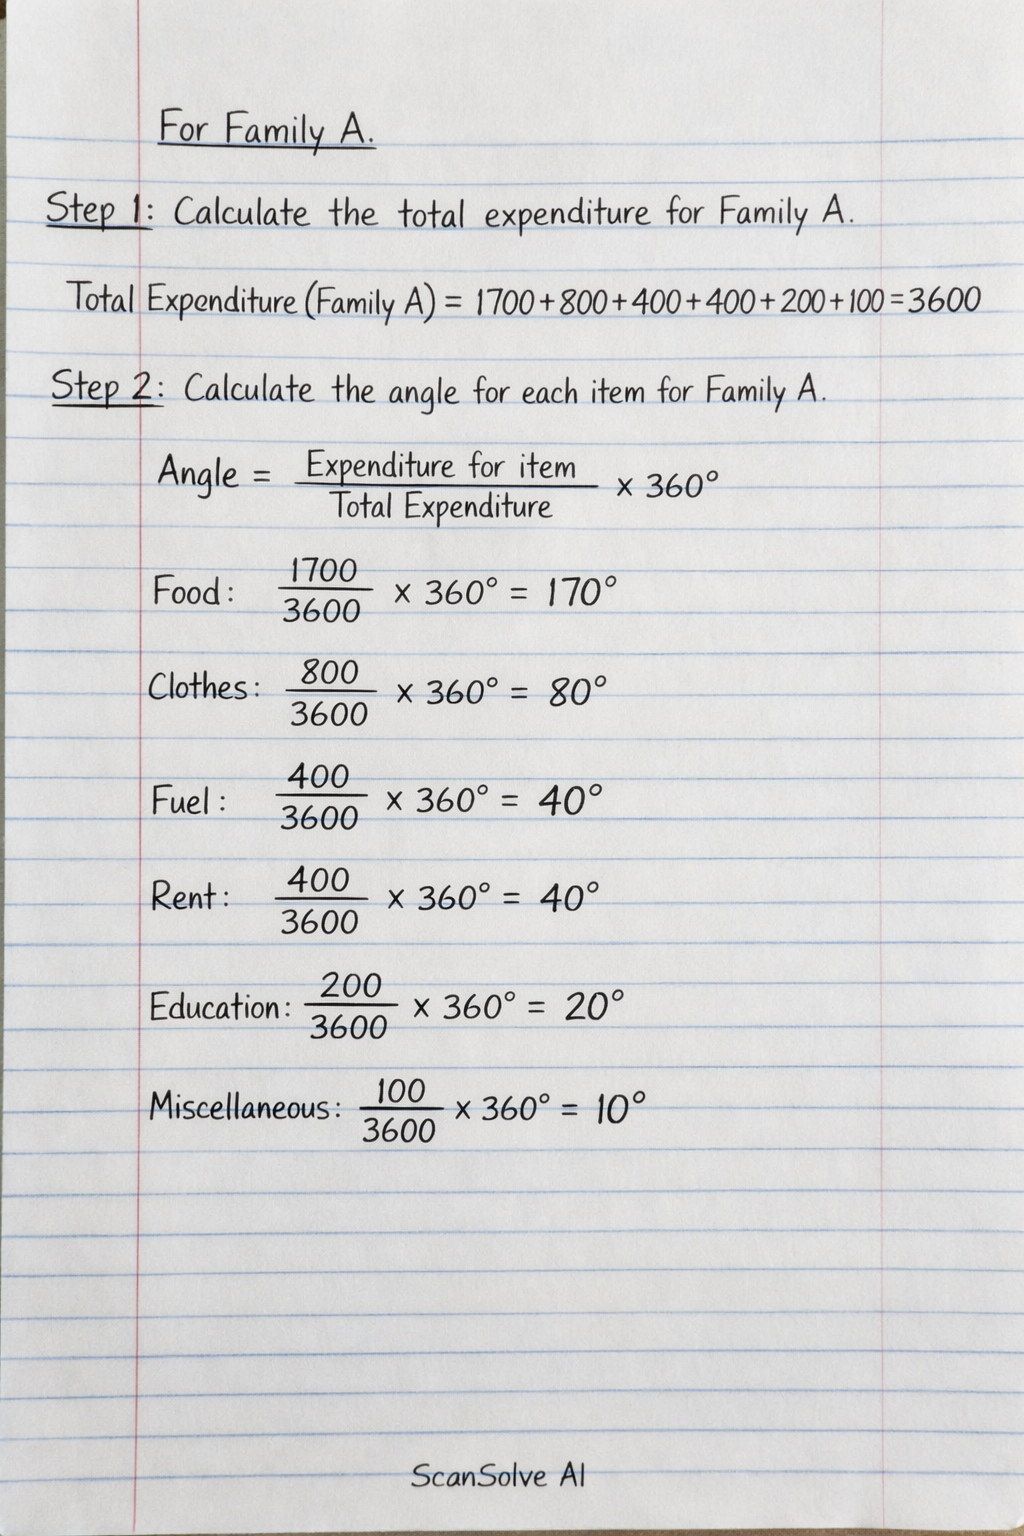
6 stepsFor Family A
Calculate the total expenditure for Family A.
Calculate the angle for each item for Family A.
The formula for the angle of a sector is:
- Food:
- Clothes:
- Fuel:
- Rent:
- Education:
- Miscellaneous:
Summarize the angles for Family A.
Item Expenditure Angle (in degrees) Food 1700 Clothes 800 Fuel 400 Rent 400 Education 200 Miscellaneous 100 Total 3600 For Family B
Calculate the total expenditure for Family B.
Calculate the angle for each item for Family B.
- Food:
- Clothes:
- Fuel:
- Rent:
- Education:
- Miscellaneous:
Summarize the angles for Family B.
Item Expenditure Angle (in degrees) Food 3300 Clothes 900 Fuel 800 Rent 600 Education 600 Miscellaneous 200 Total 6400 How to prepare the pie diagrams:
- Draw a circle for Family A and another circle for Family B.
- Mark the center of each circle.
- Draw a radius from the center to the circumference. This will be the starting line for the first sector.
- Using a protractor, measure and draw the angle for each item, starting from the previous line. For example, for Family A, draw a sector for Food, then from the end of that sector, draw an sector for Clothes, and so on.
- Label each sector with its corresponding item (e.g., Food, Clothes) and its percentage or value.
- Optionally, use different colors or patterns for each sector to distinguish them.
The calculated angles for each family are:
Family A:- Food:
- Clothes:
- Fuel:
- Rent:
- Education:
- Miscellaneous:
Family B:
- Food:
- Clothes:
- Fuel:
- Rent:
- Education:
- Miscellaneous:
Was this helpful?
Still stuck on this one?
Ask a follow-up, and the answer starts from this question.
Got a different question?Ask your own question
More Mathematics Questions
QA pie chart shows the expenditure of a household. Food expenditure is represented by angle x…QCreate a Pareto chart for the given expenditure data, showing the percentage of total expenditure…QA pie chart shows a child's daily activities. Homework: 120°, School: 90°, Play: 40°, Sleep: 90°…QCalculate the angles for a pie chart of university admissions and the variance for an ages…QRepresent the given data about students' favorite games and languages using pie charts. Calculate…
Handwritten Step-by-Step Solution
Get this as a handwritten image on WhatsApp — like a tutor wrote it for you.
Try on WhatsApp