
We read your photo as:
A pie chart shows the expenditure of a household. Food expenditure is represented by angle x, medication by 90 degrees, and another category by 70 degrees. Rent expenditure is the remaining category.
Mathematics
ScanSolve AI Answer
This answer stops before the end.
It was cut off when it was first written. Ask ScanSolve this question again for the full working.
To solve this problem, we need to determine the angles for each category of expenditure and then use the given financial information to find the total expenditure.
Step 1: Identify the angles for each category.
From the pie chart, we have:
- Angle for Food:
- Angle for Medication:
- Angle for an unlabeled category (let's call it 'Other'):
- Angle for Rent: (This is the remaining sector)
The sum of angles in a circle is .
Was this helpful?
Still stuck on this one?
Ask a follow-up, and the answer starts from this question.
Got a different question?Ask your own question
More Mathematics Questions
QCalculate the angles for each expenditure category for Family A to create a pie diagram.QA pie chart shows a child's daily activities. Homework: 120°, School: 90°, Play: 40°, Sleep: 90°…QConstruct a Pareto chart to represent the expenditure of a household with the following details…QI) Make a pie chart to show the distribution of the money. ii) What fraction of the money is spent…QThe pie chart below shows how Mr. Brown spent his salary in the month of January, 2010. He spent…
Browse by topic:Statistics
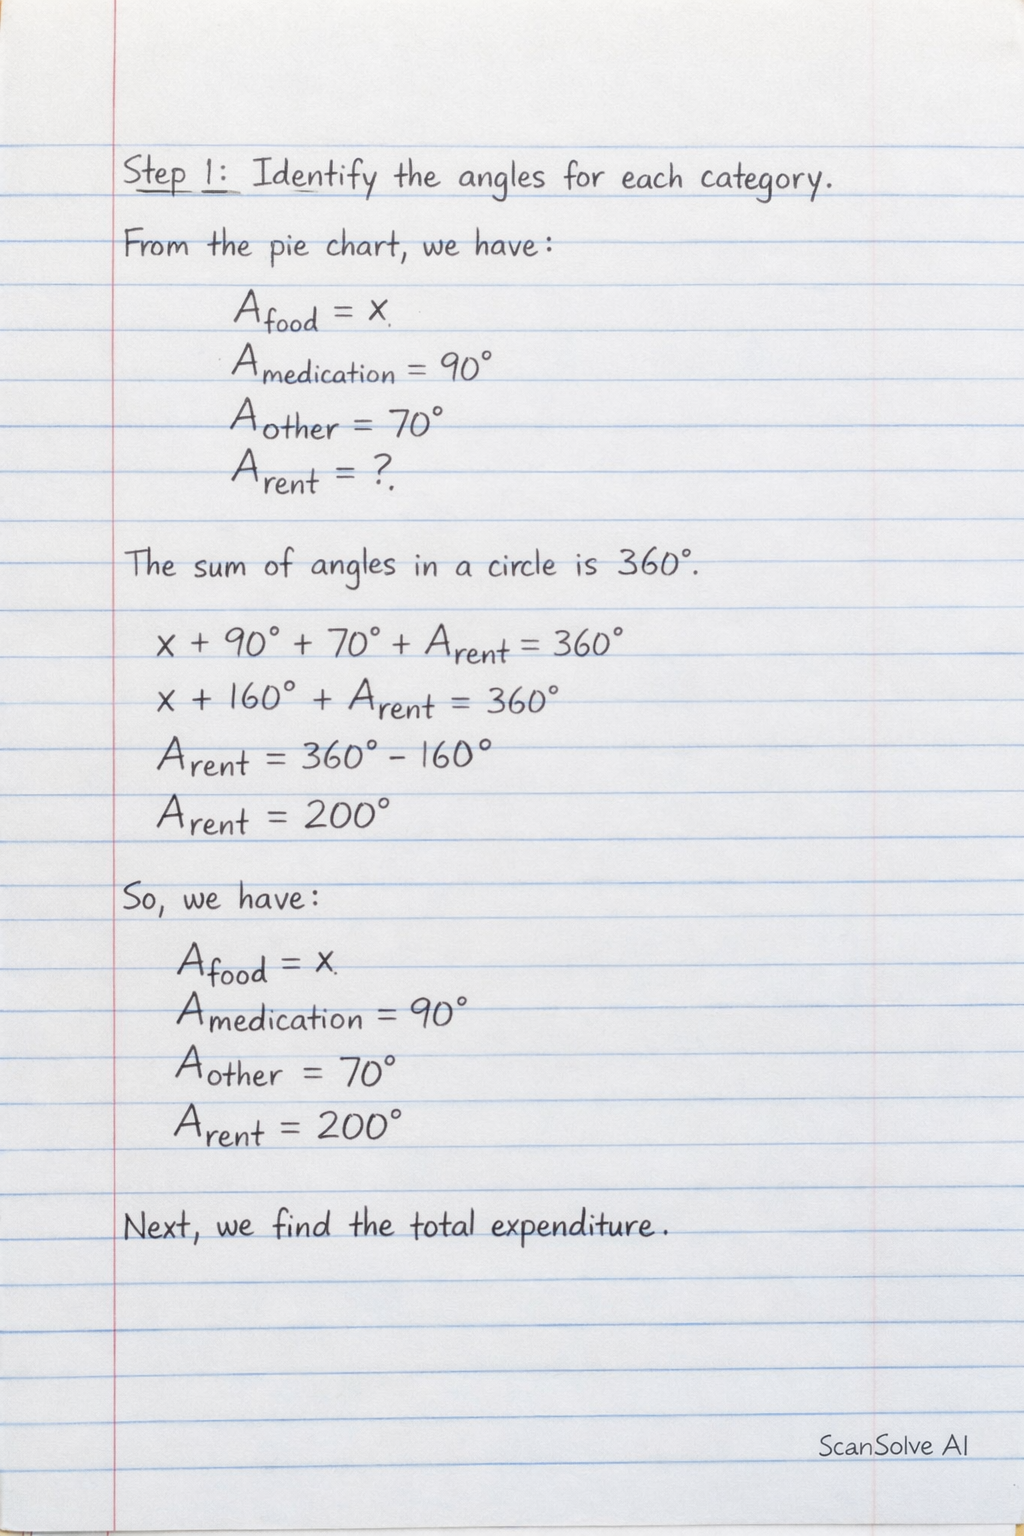
Handwritten Step-by-Step Solution
Get this as a handwritten image on WhatsApp — like a tutor wrote it for you.
Try on WhatsApp