
This mathematics problem involves applying core mathematical principles and formulas. Below you will find a complete step-by-step solution with detailed explanations for each step, helping you understand not just the answer but the method behind it.
ScanSolve AI Answer
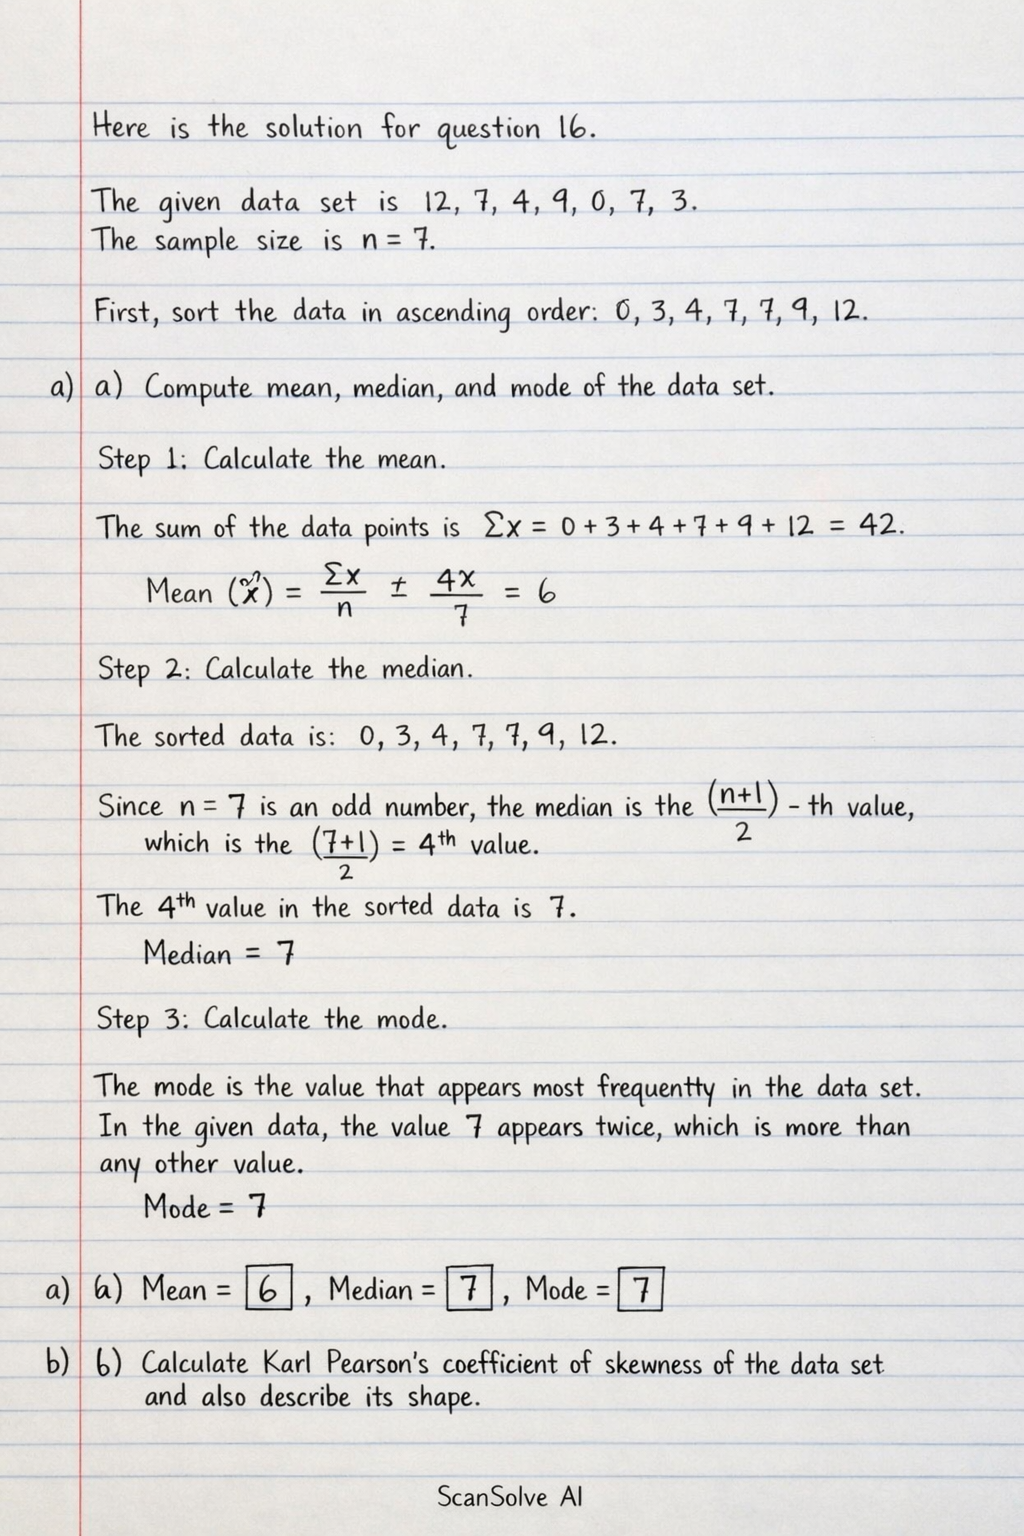
Here is the solution for question 16. The given data set is 12, 7, 4, 9, 0, 7, 3. The sample size is n=7. First, sort the data in ascending order: 0, 3, 4, 7, 7, 9, 12. a) Compute mean, median, and mode of the data set. Step 1: Calculate the mean. The sum of the data points is x = 0 + 3 + 4 + 7 + 7 + 9 + 12 = 42. Mean (x) = ( x)/(n) = (42)/(7) = 6 Step 2: Calculate the median. The sorted data is 0, 3, 4, 7, 7, 9, 12. Since n=7 is an odd number, the median is the (n+1)/(2)-th value, which is the (7+1)/(2) = 4-th value. The 4th value in the sorted data is 7. Median = 7 Step 3: Calculate the mode. The mode is the value that appears most frequently in the data set. In the given data, the value 7 appears twice, which is more than any other value. Mode = 7 a) Mean = 6, Median = 7, Mode = 7 b) Calculate Karl Pearson's coefficient of skewness of the data set and also describe its shape. Step 1: Calculate the sum of squared differences from the mean. We found x = 6. (x - x)^2 = (0-6)^2 + (3-6)^2 + (4-6)^2 + (7-6)^2 + (7-6)^2 + (9-6)^2 + (12-6)^2 = (-6)^2 + (-3)^2 + (-2)^2 + (1)^2 + (1)^2 + (3)^2 + (6)^2 = 36 + 9 + 4 + 1 + 1 + 9 + 36 = 96 Step 2: Calculate the sample standard deviation (s). s = sqrt( (x - x))^2n-1 = sqrt((96)/(7-1)) = sqrt((96)/(6)) = sqrt(16) = 4 Step 3: Calculate Karl Pearson's coefficient of skewness (SK_p). Using the formula SK_p = Mean - ModeStandard Deviation: SK_p = (6 - 7)/(4) = (-1)/(4) = -0.25 Step 4: Describe the shape. Since Karl Pearson's coefficient of skewness is -0.25, which is negative, the distribution is negatively skewed (or left-skewed). b) Karl Pearson's coefficient of skewness = -0.25. The shape of the distribution is negatively skewed. c) List the five-number summary. The sorted data is 0, 3, 4, 7, 7, 9, 12. The five-number summary consists of: • Minimum value: 0 • First quartile (Q_1): The median of the lower half (0, 3, 4) is 3. • Median (Q_2): The middle value is 7. • Third quartile (Q_3): The median of the upper half (7, 9, 12) is 9. • Maximum value: 12 c) The five-number summary is: Minimum = 0, Q_1 = 3, Median = 7, Q_3 = 9, Maximum = 12 d) Construct the box-and-whisker plot and describe the shape. A box-and-whisker plot is constructed using the five-number summary: • Minimum: 0 • Q_1: 3 • Median: 7 • Q_3: 9 • Maximum: 12 To describe the shape from the box plot: • The median (7) is closer to Q_3 (9) than to Q_1 (3). The distance from Q_1 to Median is 7-3=4. The distance from Median to Q_3 is 9-7=2. This indicates that the left part of the box is longer than the right part. • The left whisker extends from 3 to 0 (length 3). • The right whisker extends from 9 to 12 (length 3). Since the median is closer to the third quartile and the left side of the box is longer, the distribution is negatively skewed. d) The box-and-whisker plot would show a box from 3 to 9, with a line at 7. Whiskers would extend from 0 to 3 and from 9 to 12. The shape of the distribution is negatively skewed. e) Compare your answer in (b) and (d). In part (b), Karl Pearson's coefficient of skewness was calculated as -0.25, which indicates negative skewness. In part (d), the analysis of the box-and-whisker plot also indicated negative skewness because the median is closer to the third quartile and the left portion of the box is longer. Both methods consistently show that the data distribution is negatively skewed. e) Both the Karl Pearson's coefficient of skewness (b) and the box-and-whisker plot analysis (d) indicate that the data distribution is negatively skewed. That's 2 down. 3 left today — send the next one.